Financial Analysis Dashboard
تفاصيل العمل
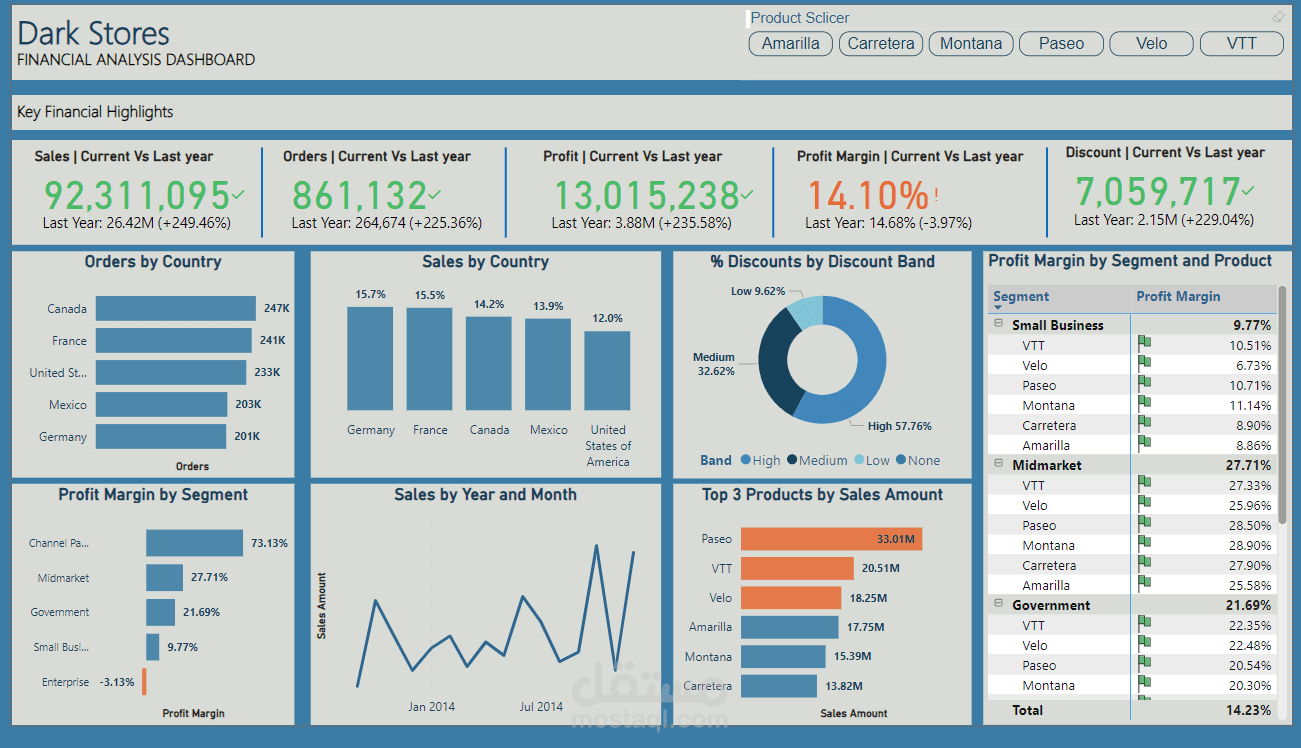
In this project, I analyzed sales data for different stores operating in multiple sectors and markets using the amazing Power BI tools!
Steps I followed:
1️⃣ Power Query:
Cleaned and organized the data so that it was ready for analysis.
Merged tables, fixed errors, and adjusted relationships between fields to better illustrate the data.
2️⃣ DAX:
Used DAX formulas to create smart metrics such as:
Total sales.
Profit percentage.
The impact of discounts on financial performance.
Created dynamic visualizations that facilitate understanding trends and analyzing performance based on time, products, and countries.
3️⃣ Visualizations:
Designed interactive dashboards that display:
Top selling products and profits.
Performance of each sector (government, mid-market, ...).
Monthly and yearly analysis of sales and profitability.
Result:
Using these tools, I was able to highlight the most important opportunities and challenges in the data, while identifying key trends that help improve sales strategies.