Online Sales Analysis
تفاصيل العمل
Online-Sales-Analysis
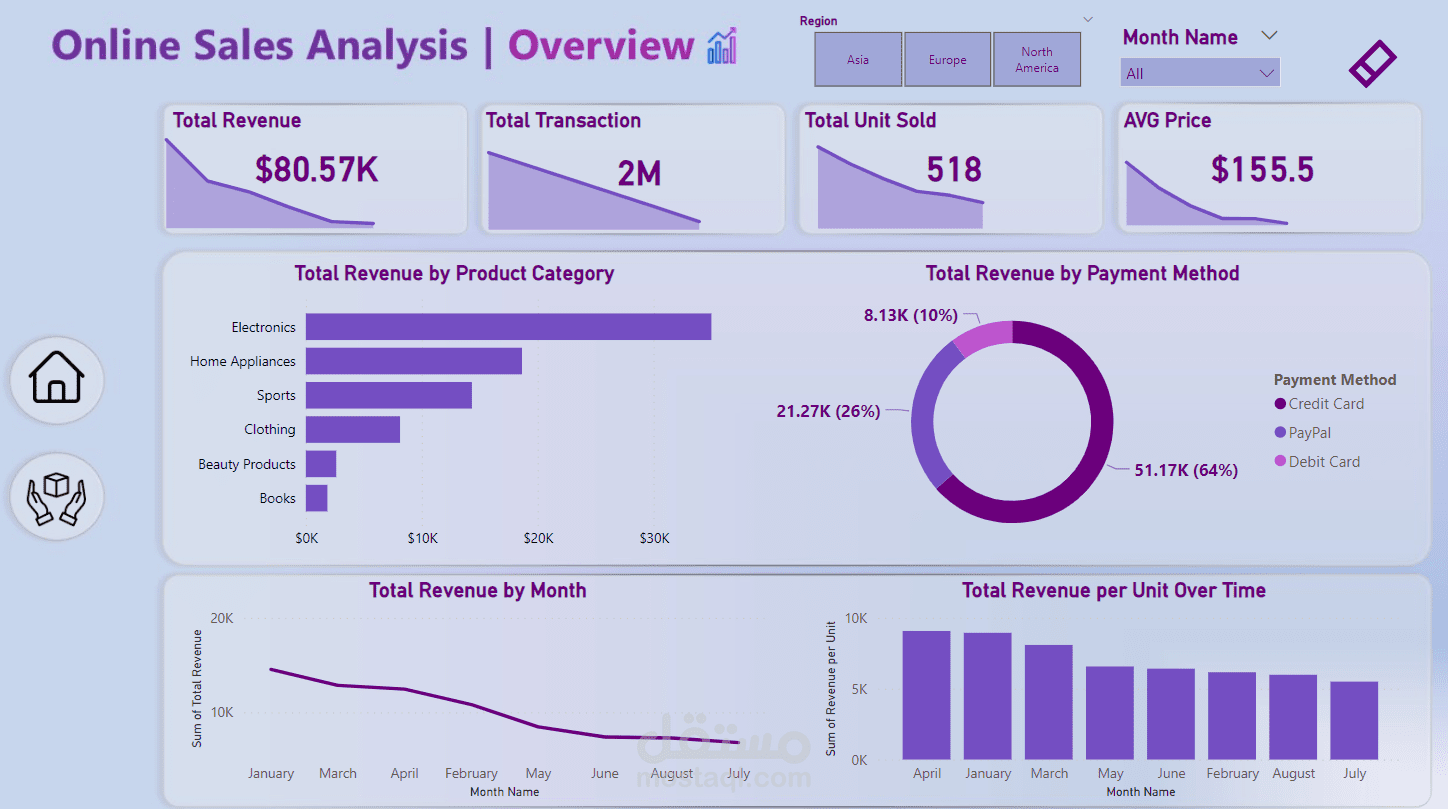
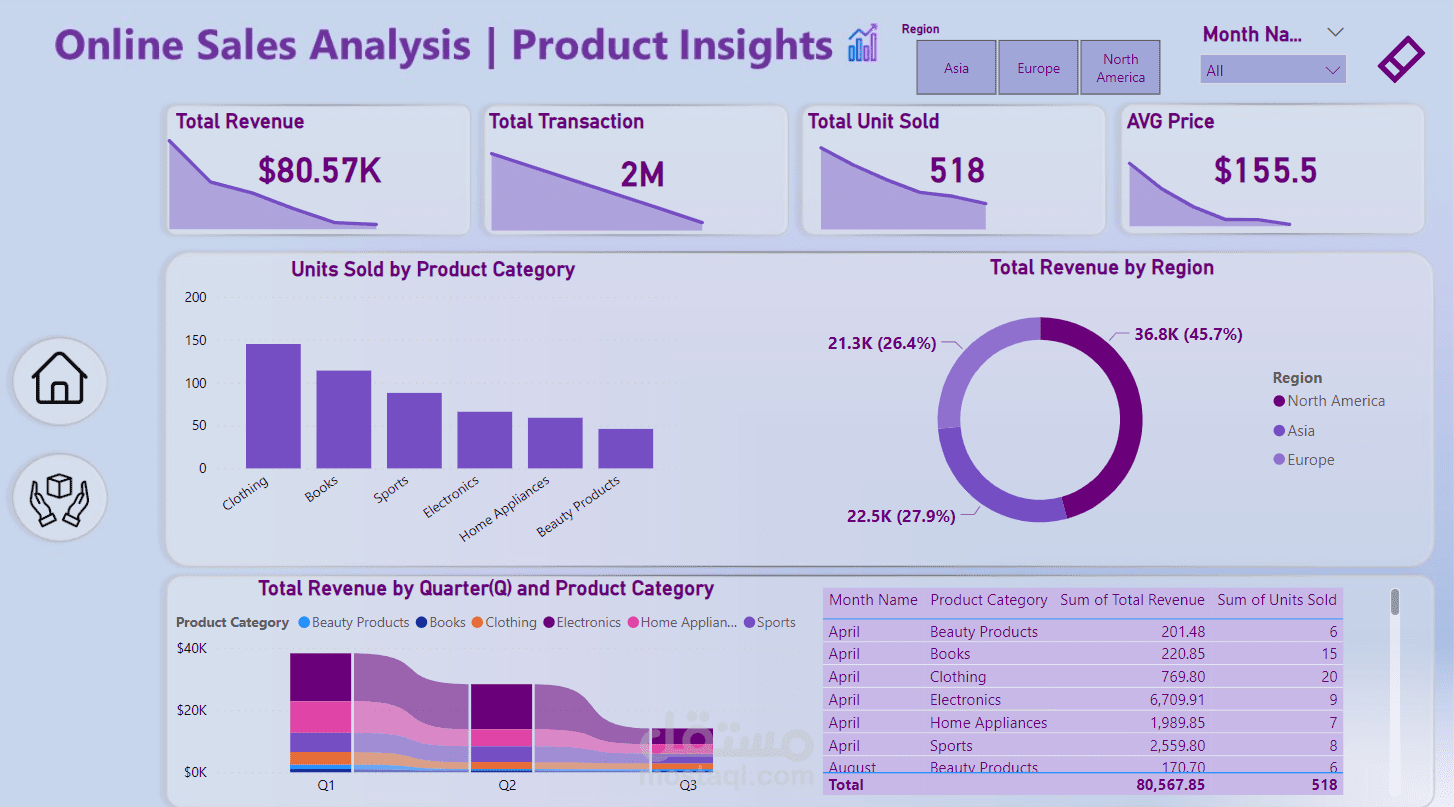
Key Highlights:
Total Revenue: 80.5
Total Transactions: 2M
Total Units Sold: 518
Average Price per Unit: 155.5
Visualizations:
Bar Chart for Total Sales by Product Category, giving a clear comparison of which product categories contribute the most to sales.
Donut Chart for Total Revenue by Payment Method, showing the breakdown of revenue across different payment methods.
Line Chart for Total Revenue by Month, providing a detailed view of monthly sales trends and helping identify seasonality and growth patterns.
Clustered Bar Chart for Total Revenue per Unit Over Time, offering insights into how revenue per unit has changed over time.
Tools & Techniques:
Power BI to create dynamic, interactive visualizations.
DAX Measures for calculating Total Revenue, Average Price, and other critical metrics.
Filters and slicers for deeper exploration of sales performance by category, payment method, and time.