Car Sales Analysis
تفاصيل العمل
Car-Sales-Report
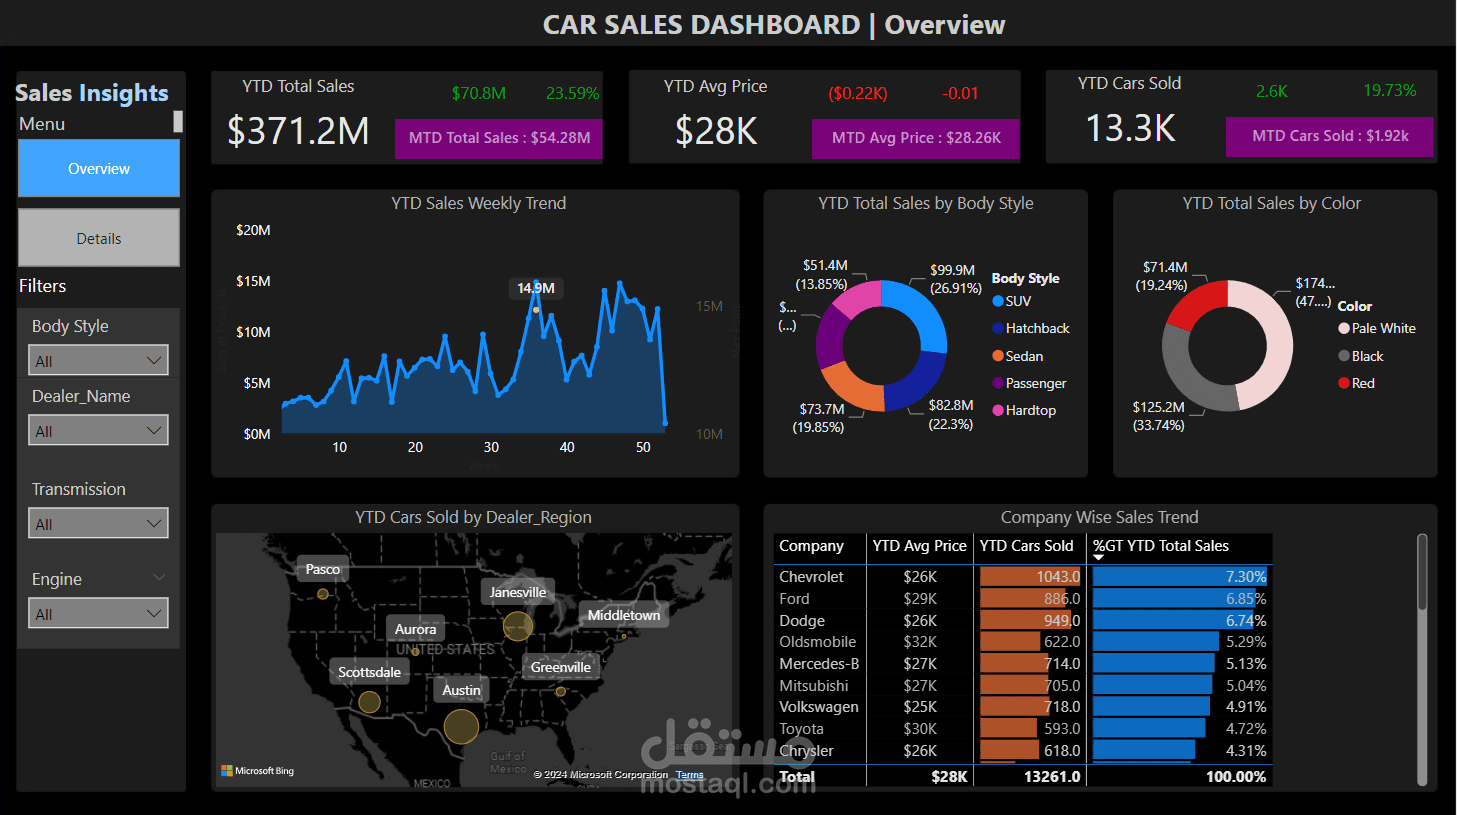
Key Features of the Dashboard:
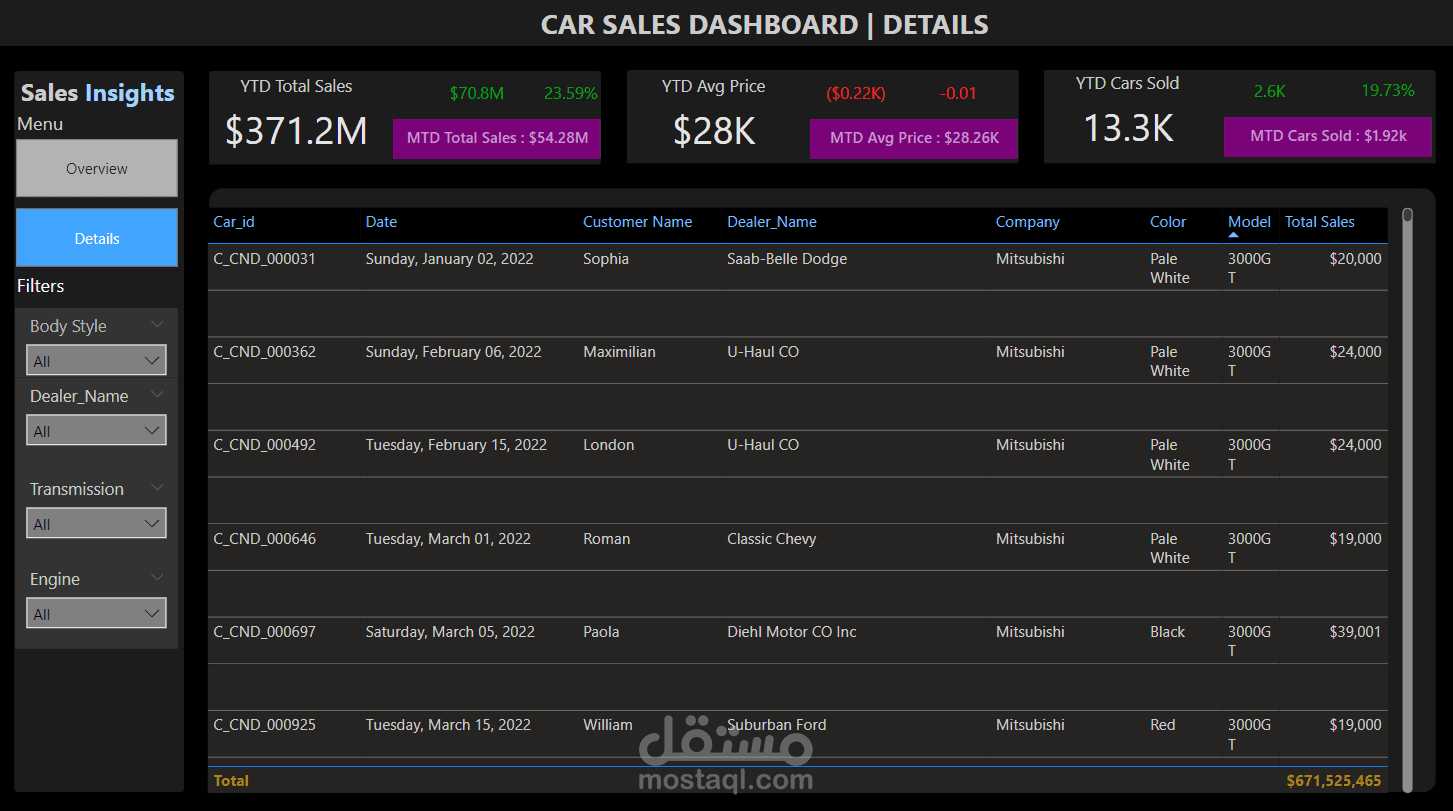
YTD Total Sales: Track year-to-date total sales to measure overall performance.
YTD Avg Price: Monitor the average price of cars sold throughout the year.
YTD Cars Sold: Keep a count of the total number of cars sold year-to-date.
YTD Sales Weekly Trend: Analyze weekly sales trends to identify patterns and peak periods.
YTD Total Sales by Body Style: Breakdown of total sales by various car body styles.
YTD Total Sales by Color: Insight into which car colors are most popular among buyers.
YTD Cars Sold by Dealer Region: Visualize car sales across different dealer regions to understand regional performance.
Company Wise Sales Trend: Track sales trends of different car companies to gauge market share and competitiveness.
Why This Dashboard Matters:
This dashboard is designed to provide stakeholders with critical insights and actionable data to enhance sales strategies and operational efficiency. By leveraging Power BI’s powerful analytics and visualization capabilities, we can turn raw data into meaningful information.