Product Sales Analysis
تفاصيل العمل
Product Sales Analysis: Comprehensive Insights Across Regions
This project focuses on a detailed analysis of product sales across various regions, utilizing a well-structured Star Schema data model to enhance reporting and analytics efficiency. The goal was to uncover actionable insights, optimize sales strategies, and improve decision-making processes.
Data Model Design:
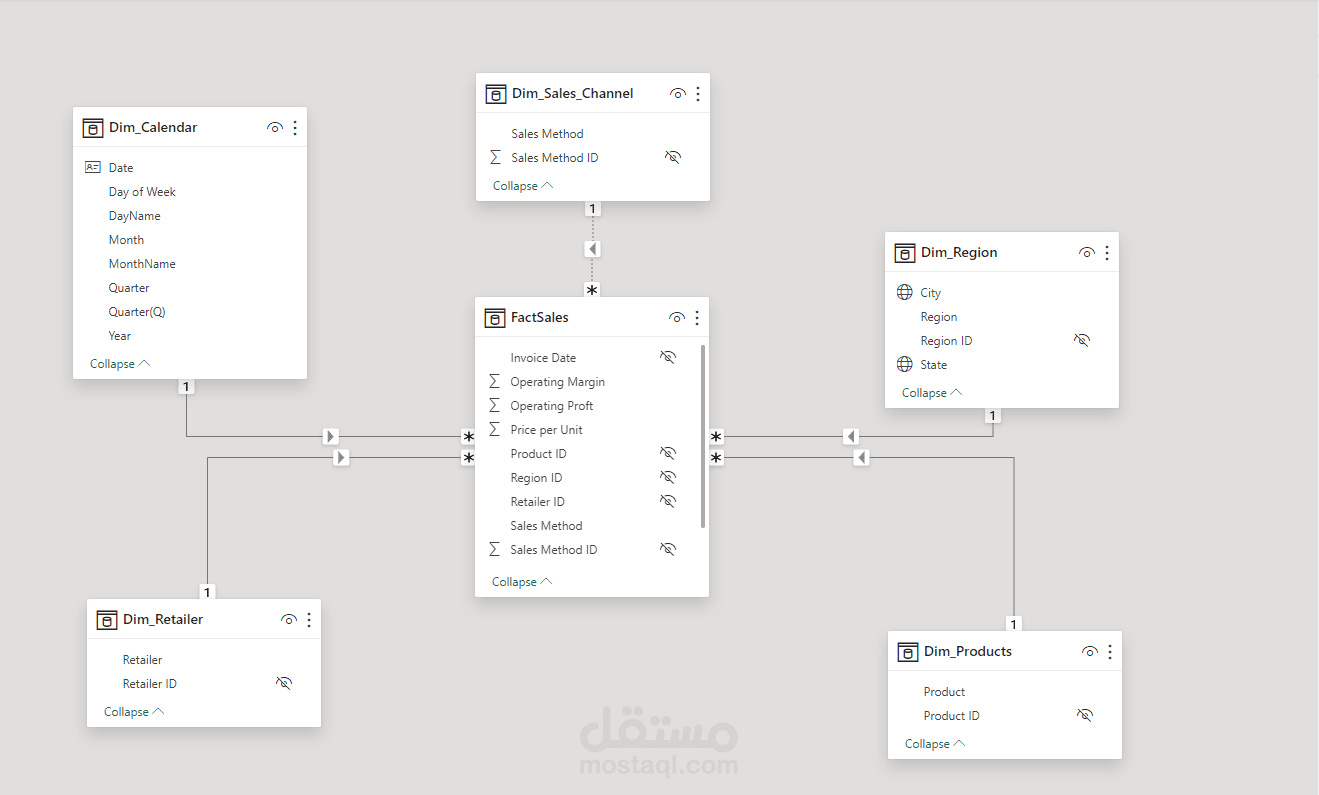
To enable efficient analysis and reporting, I designed a Star Schema consisting of:
Fact Table:
Sales: Captures key metrics such as total sales, total profit, units sold, and total orders, serving as the central data repository for quantitative analysis.
Dimension Tables:
Products: Details about product names, categories, and attributes.
Customers: Insights into customer demographics and behaviors.
Time: Includes details like year, quarter, month, and day for time-based analysis.
Regions and Locations: Captures geographical data to analyze sales performance by area.
Key Highlights and Insights:
Total Sales:
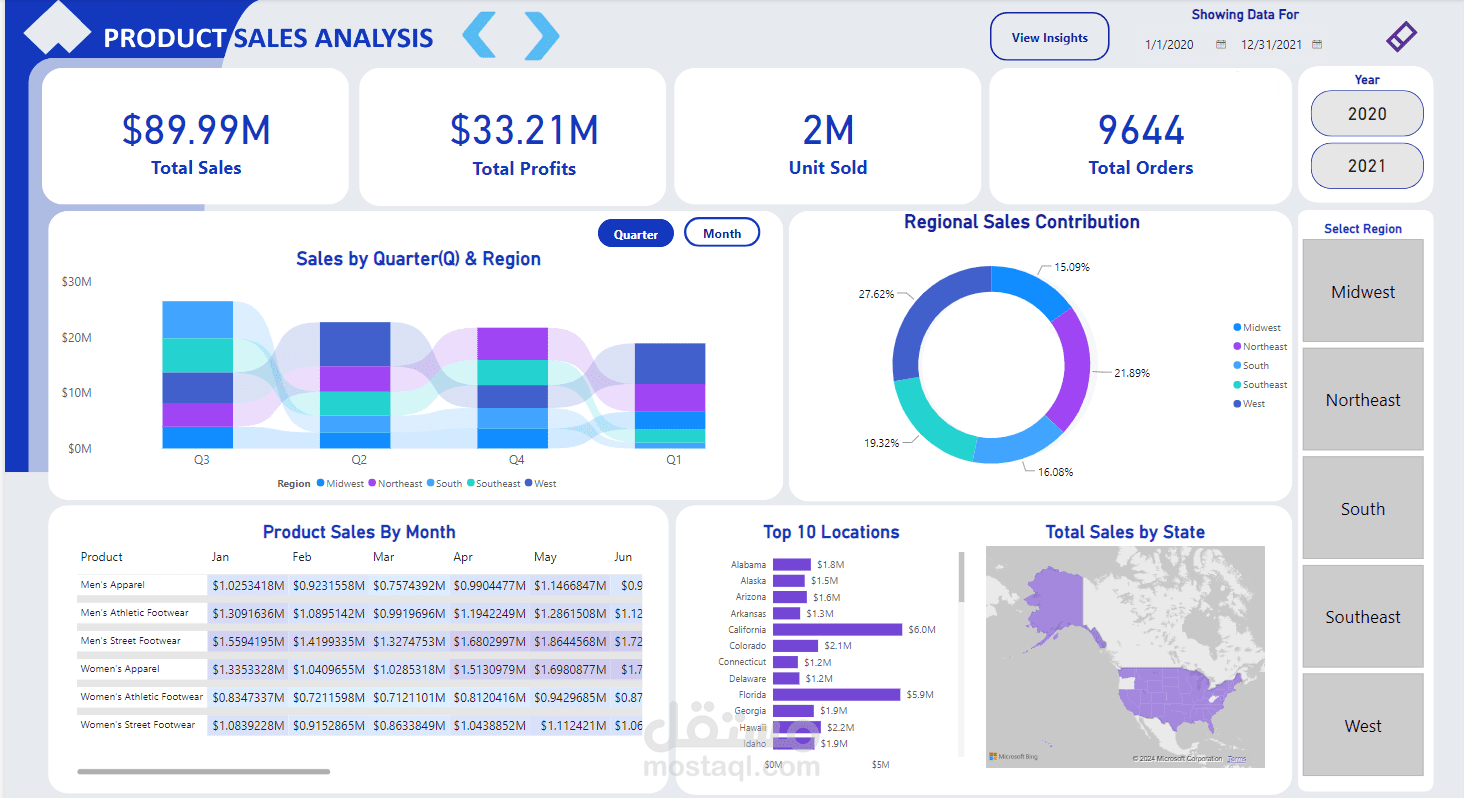
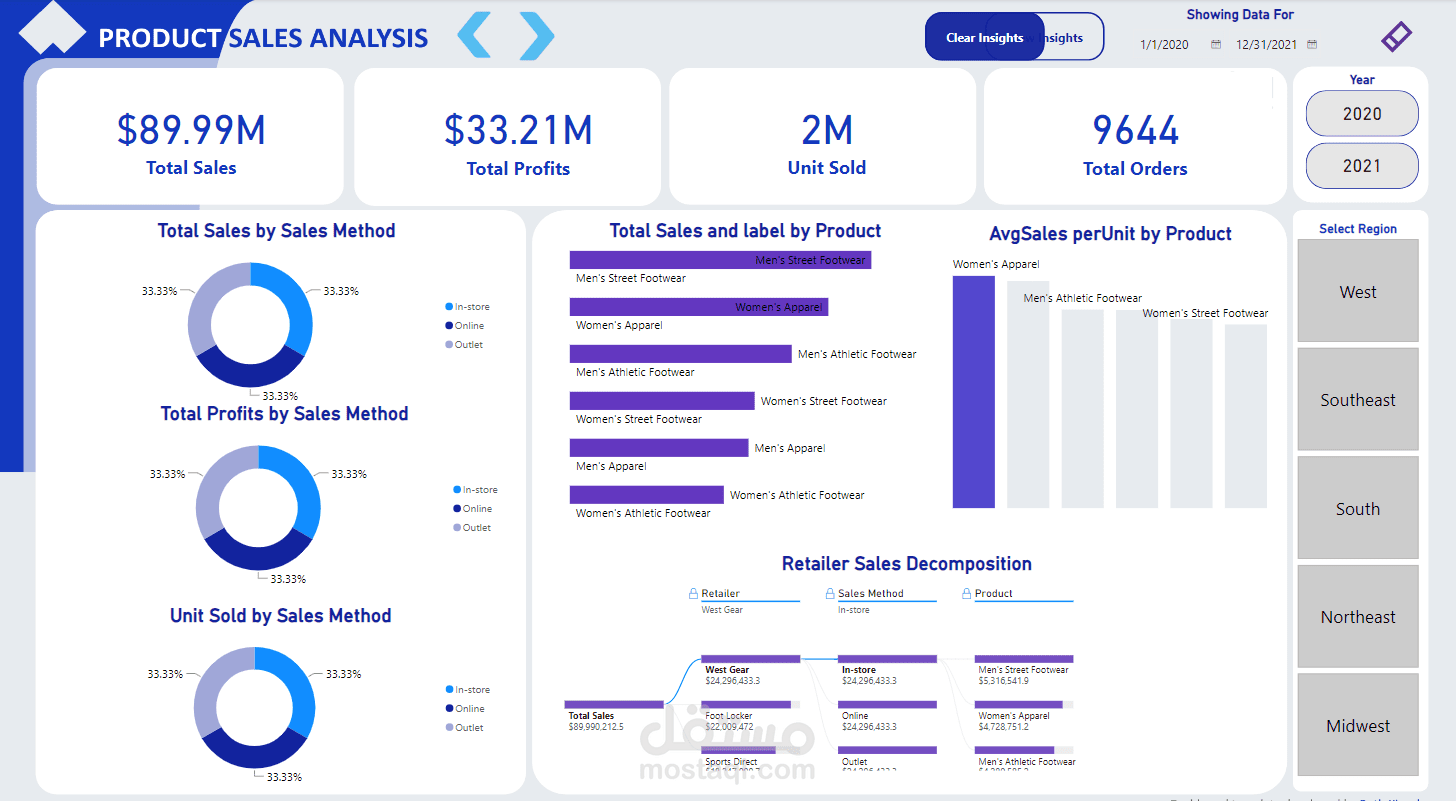
$89.99M
Represents the sum of all revenue generated during the specified period. This metric provides an overall view of business performance and growth potential.
Total Profit:
$33.21M
Indicates net earnings after costs, reflecting profitability. This is crucial for assessing cost efficiency and profit margins.
Units Sold:
2M Units
Refers to the total volume of products sold, helping to gauge product demand and overall market penetration.
Total Orders:
9,644 Transactions
Represents individual customer purchases, offering insights into buying patterns, frequency, and customer engagement.
Regional Sales Contribution:
Breaks down total sales by region, highlighting high-performing and underperforming areas. This helps target marketing and resource allocation effectively.
Product Sales by Month:
Tracks monthly sales trends, identifying seasonality and fluctuations in product demand. This insight supports inventory management and promotional planning.
Top 10 Locations:
Highlights the top-performing cities or regions based on sales or units sold. These high-value areas inform market expansion and focus strategies.
Total Sales by State:
Provides a state-wise breakdown of total sales, enabling better regional strategy formulation and identification of key markets.
Sales by Quarter & Region:
Combines quarterly and region-specific data to analyze how different regions perform over time. This insight is crucial for understanding regional trends and making informed decisions about seasonal strategies.
Project Impact:
This analysis helps stakeholders:
Optimize Sales Strategies: By identifying high-performing products, regions, and time periods.
Enhance Resource Allocation: By targeting states and regions with high potential.
Improve Operational Efficiency: By understanding trends in demand and aligning inventory with customer needs.
Learning Outcomes:
This project showcased the importance of data modeling and advanced analytics in uncovering meaningful insights. By leveraging Power BI, I demonstrated how visual storytelling transforms complex datasets into actionable strategies. This experience strengthened my skills in data visualization, reporting, and deriving insights that directly support business goals.


