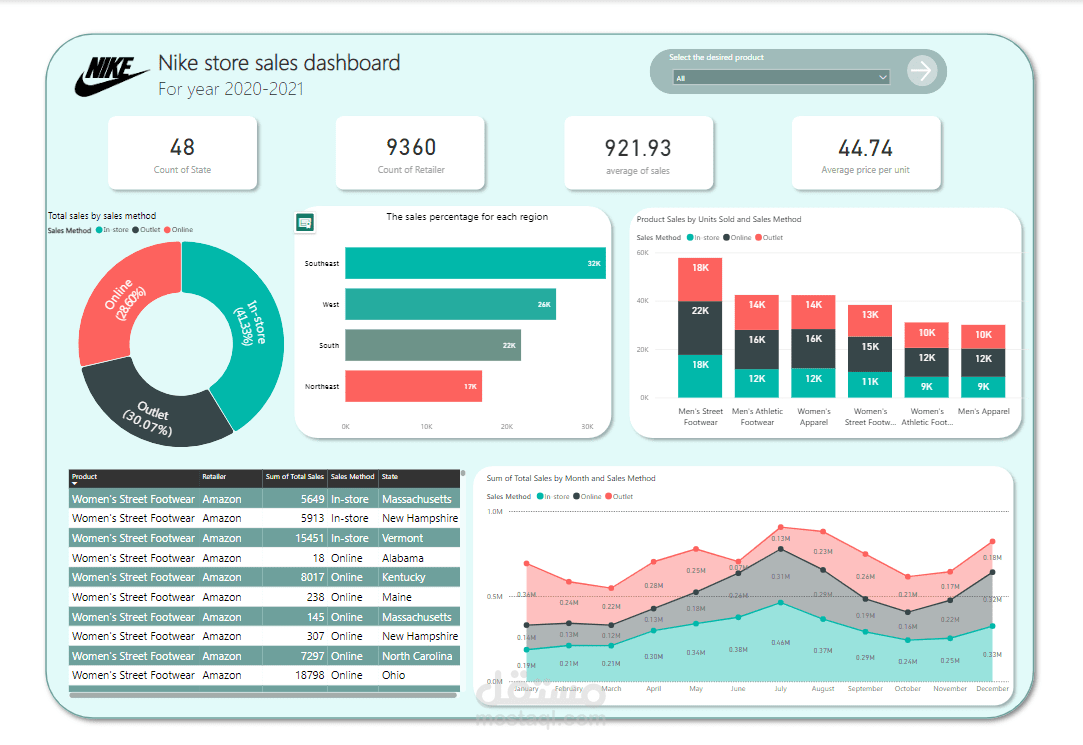
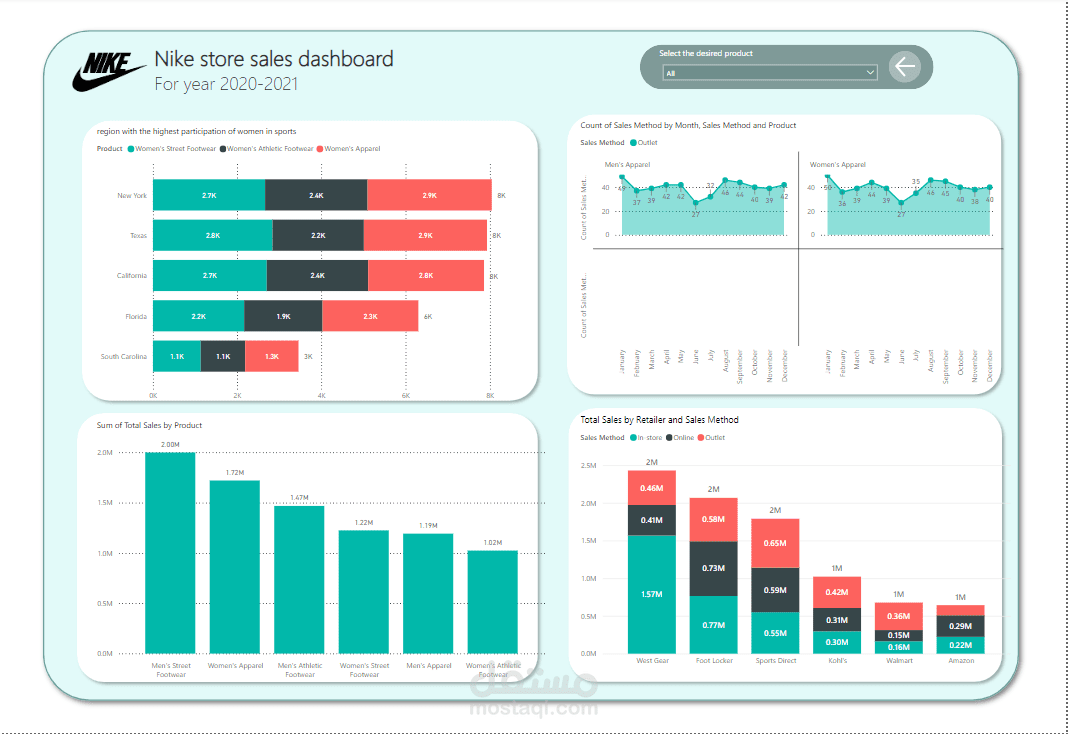
Nike Sales Performance Dashboard
تفاصيل العمل
1. Data Cleaning:
The cleaning process was minimal and straightforward:
Date Data Type Issue: The dataset had date columns in an incorrect format. To resolve this:
Split the columns as needed.
Adjusted the data types to correctly reflect dates.
2. Data Analysis:
Key metrics and insights were derived, focusing on:
Sales performance over time.
Regional and product-wise performance.
Trends in customer behavior.
3. Dashboard Design:
The dashboard was designed in Power BI with a focus on:
Clarity: Clear and concise visualizations for effective storytelling.
Interactivity: Filters and slicers to enable users to explore data dynamically.
Insights: Highlighting KPIs like total sales, growth percentage, and best-performing products.
4. Tools Used: Power BI.