Store-Sales-Data-Analysis-project
تفاصيل العمل
Project Overview
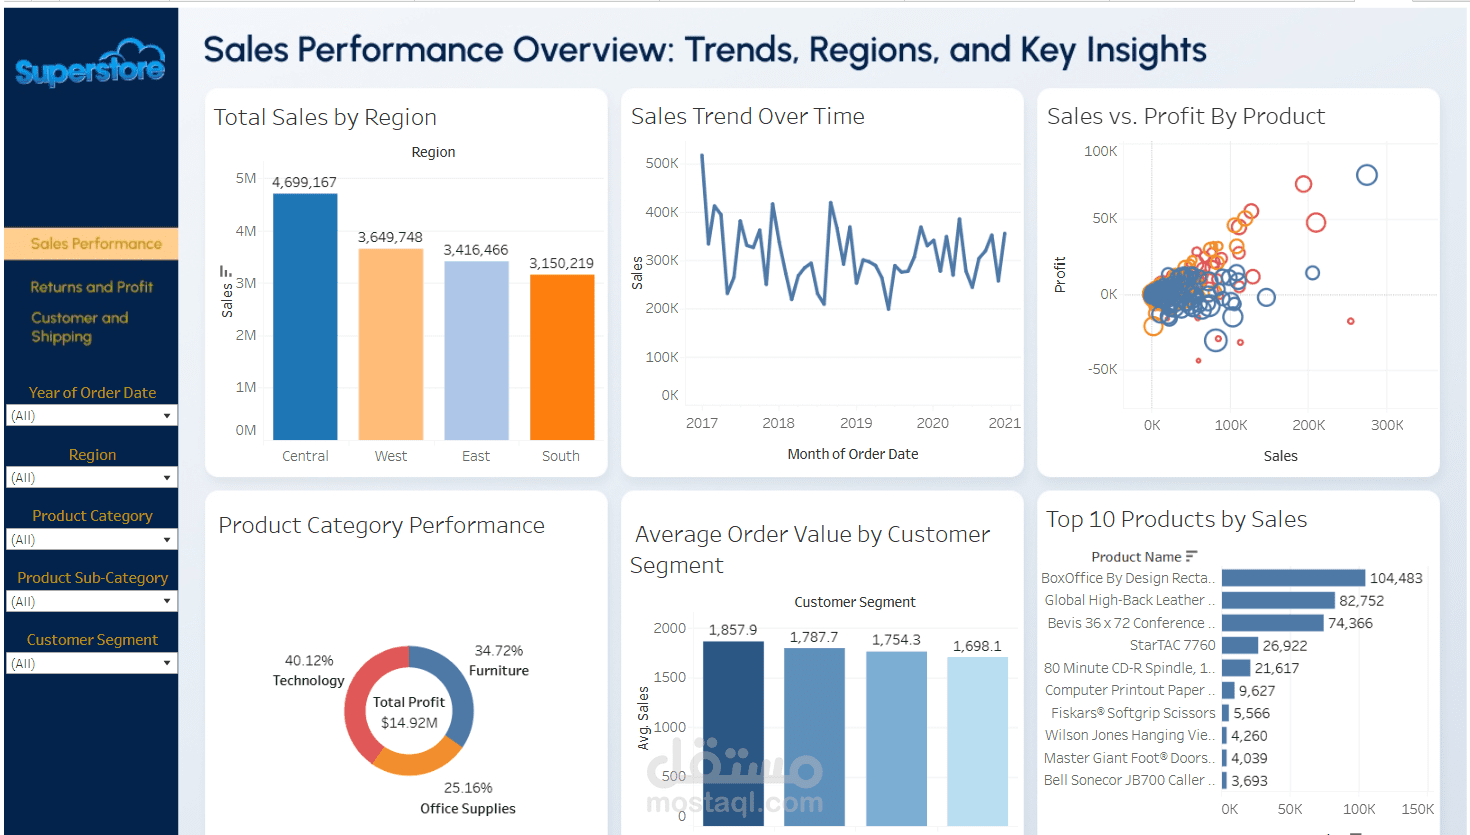
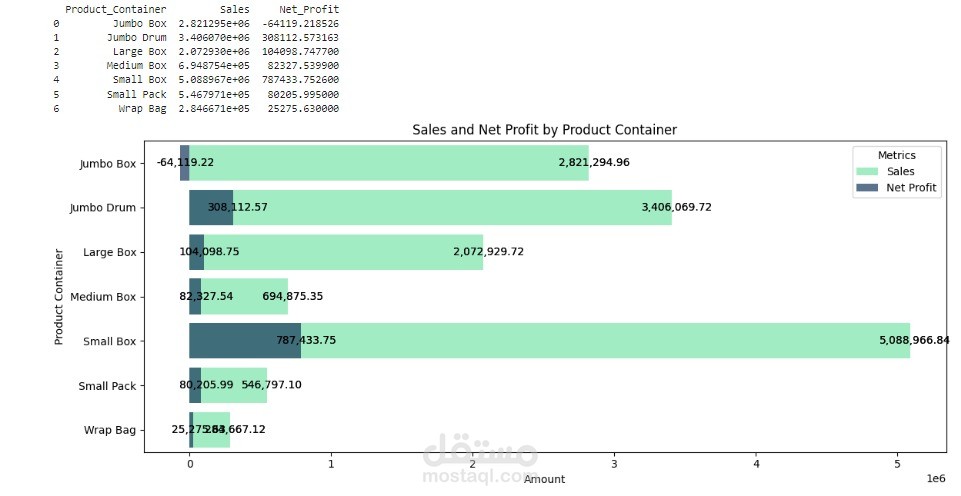
This project involves a detailed analysis of store sales data to uncover key insights and trends. The dataset includes order information, customer details, product details, and sales data. By analyzing this dataset, we aim to identify key trends, areas for improvement, and support data-driven decision-making.
Project Description
Our final project involves a detailed analysis of store sales data to uncover key insights and trends. We aim to optimize store operations and enhance customer satisfaction through data visualization and analytics.
Dataset Summary
Number of Rows: 8399
Number of Columns: 23
Data Types:
Numeric: Row ID, Sales, Profit, etc.
Categorical: Ship Mode, Customer Segment, Product Category, etc.
Datetime: Order Date
Data Available: 2017-2020
Columns Available:
'Row ID', 'Order ID', 'Order Date', 'Order Priority', 'Order Quantity'
'Sales', 'Discount', 'Ship Mode', 'Profit', 'Unit Price', 'Shipping Cost'
'Customer Name', 'Province', 'Region', 'Customer Segment', 'Product Category'
'Product Sub-Category', 'Product Name', 'Product Container', 'Product Base Margin', 'Ship Date'
Additional Tables:
Users table:
'Region'
'Manager'
Returns table:
'Order Id'
'Status'
Techniques Used:
Data Quality:
Data Validation & Cleaning
Handling Missing Values
Correcting Data Types
Removing Duplicate Rows
Outlier Detection
Exploratory Data Analysis (EDA):
Univariate Analysis
Bi-variate Analysis
Multi-variate Analysis
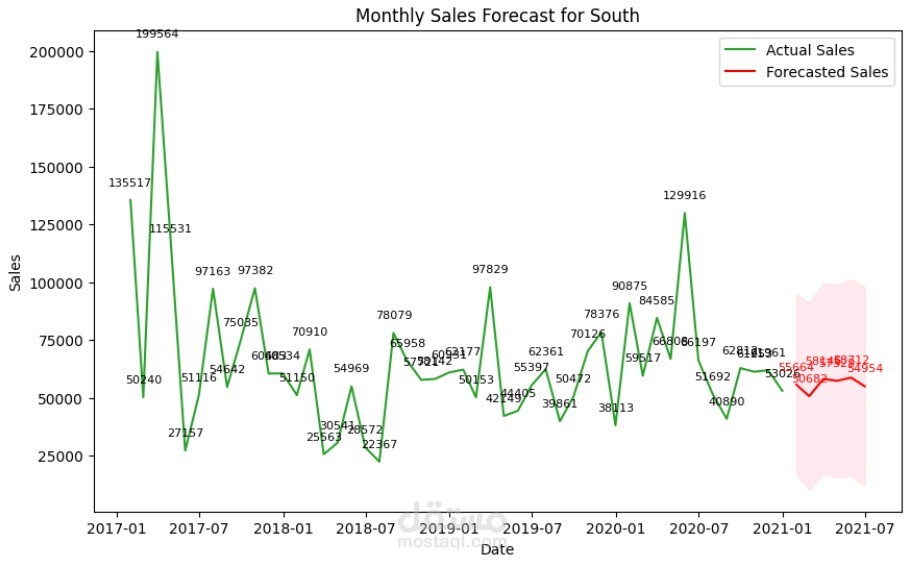
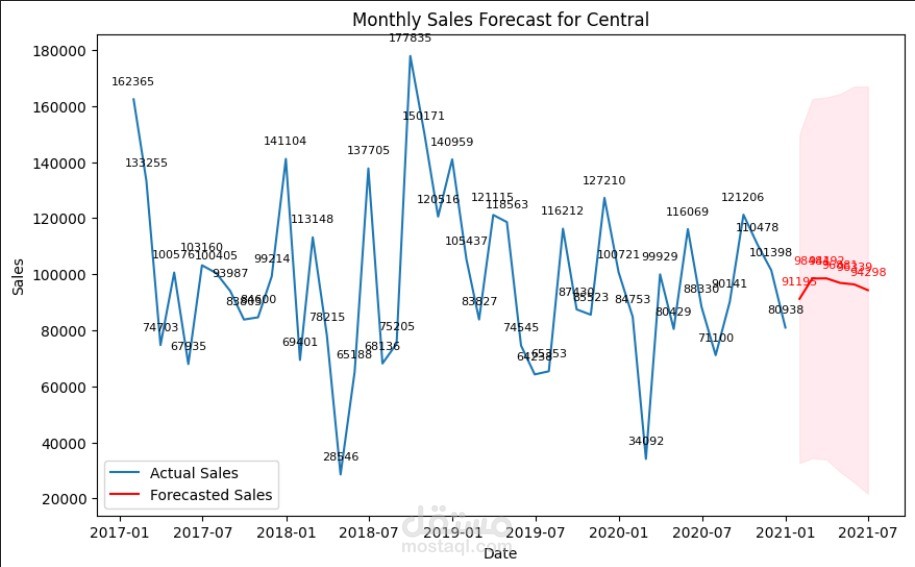
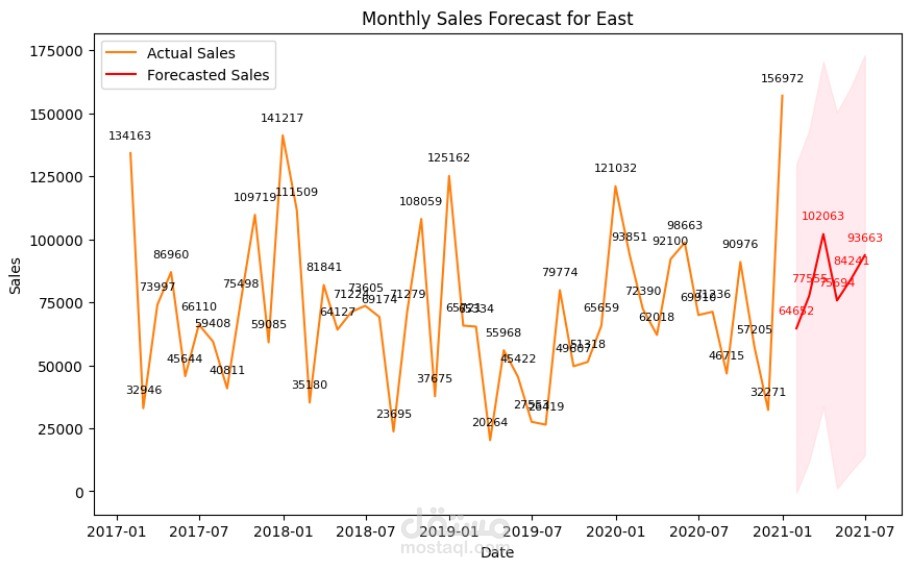
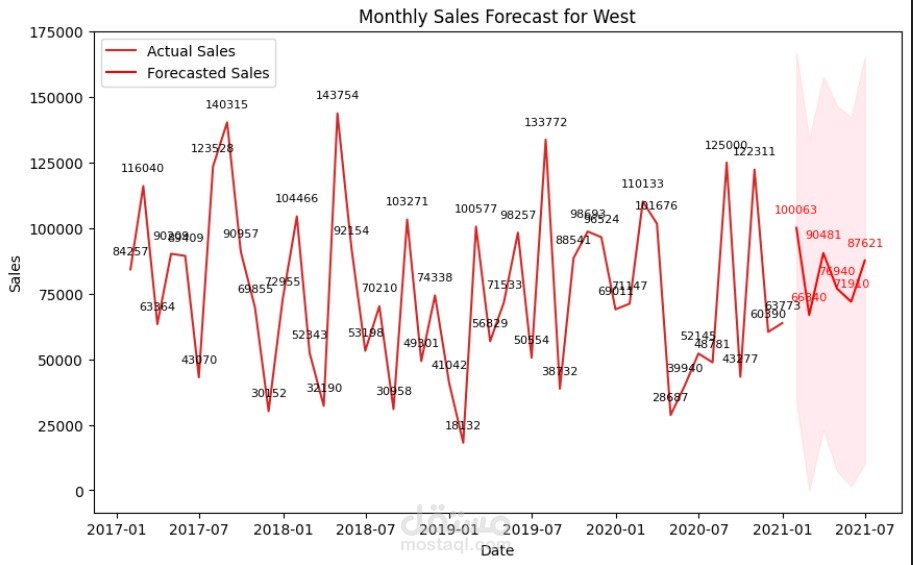
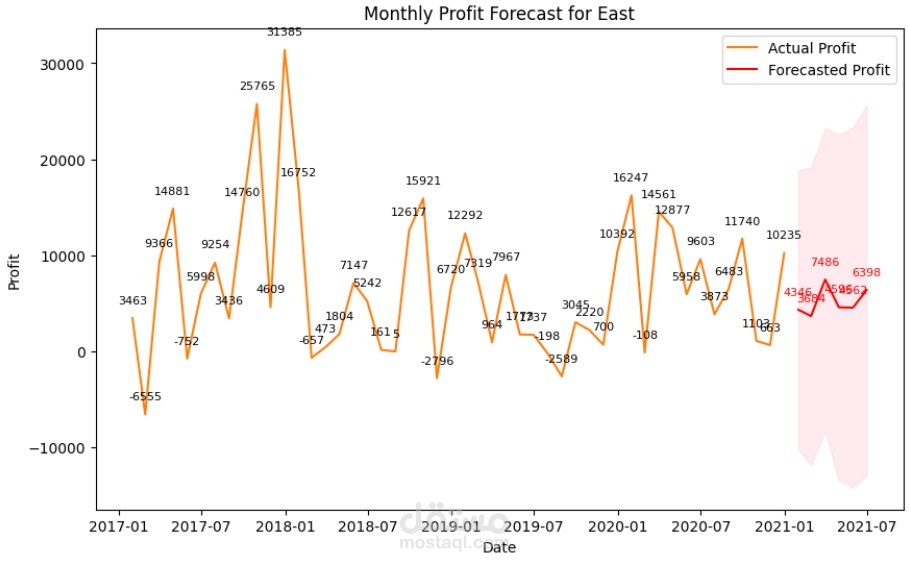
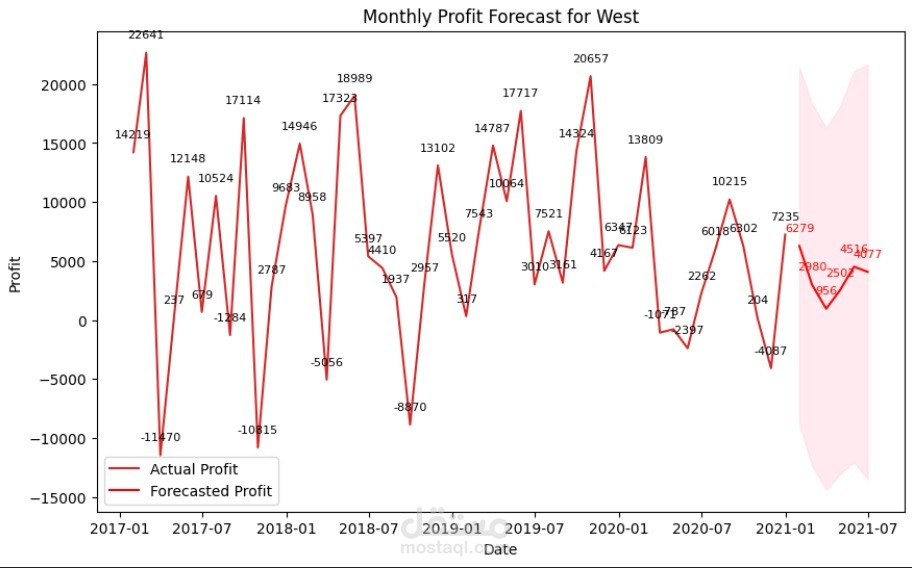
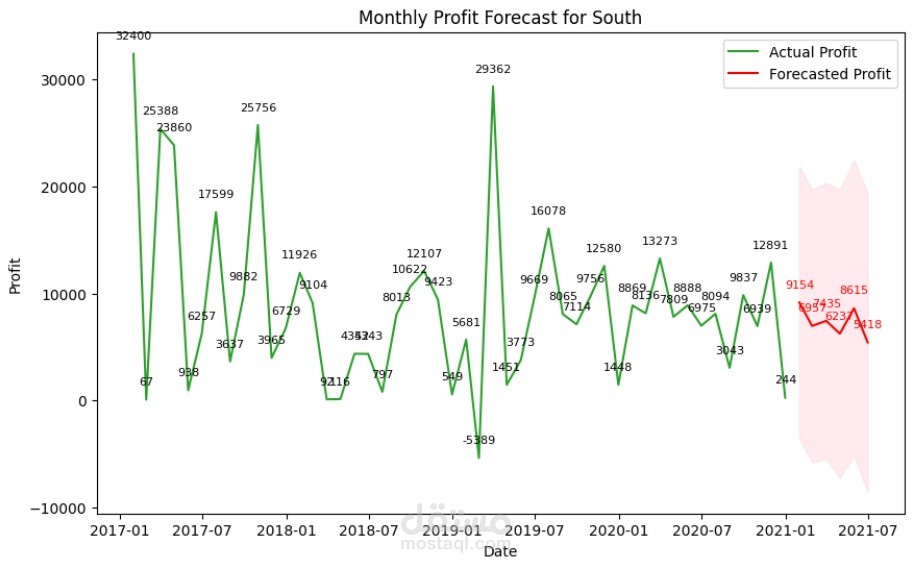
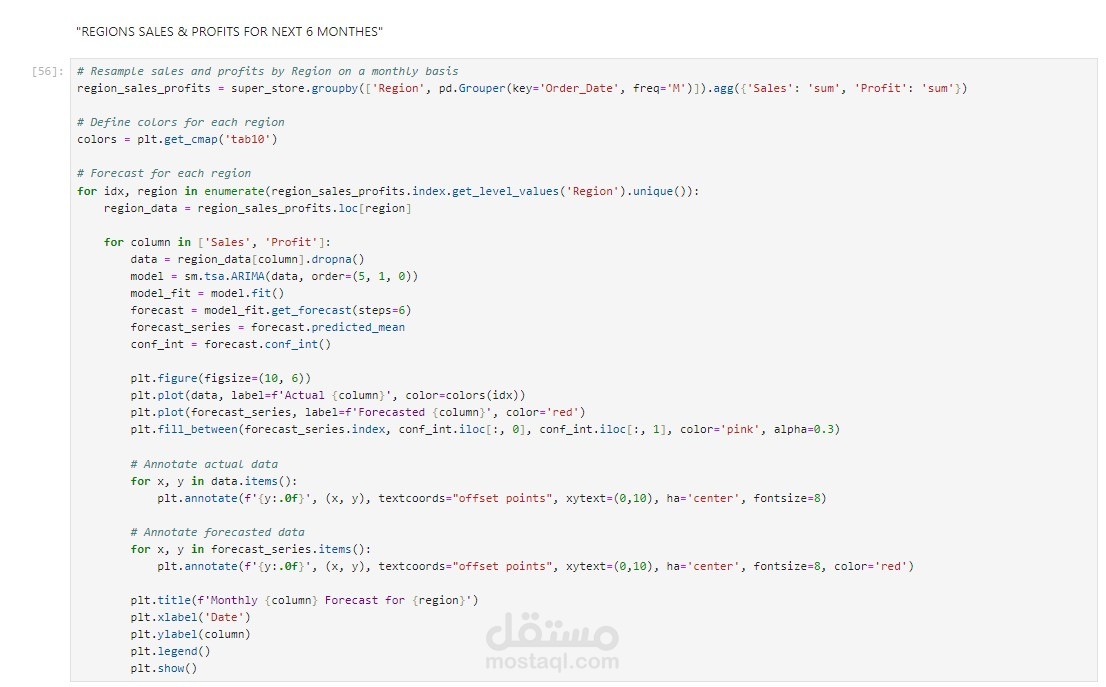
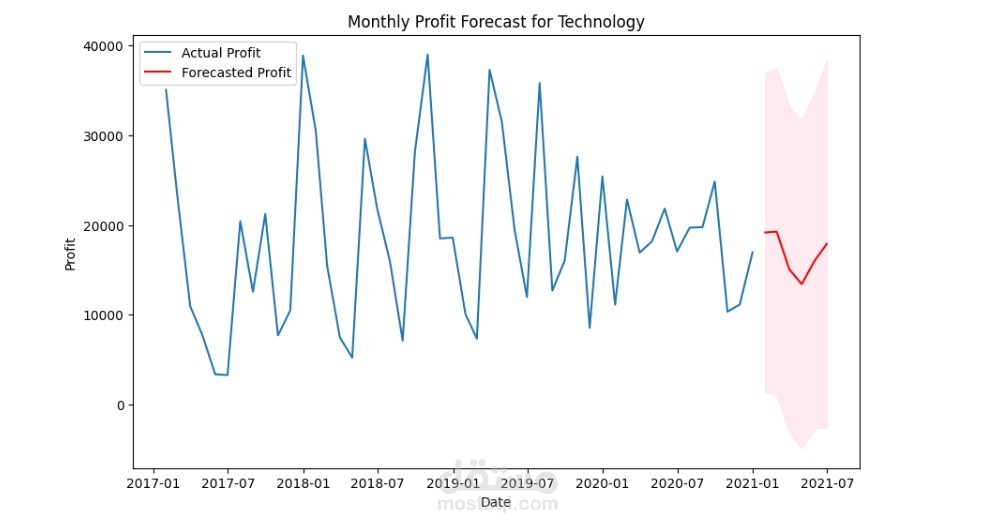
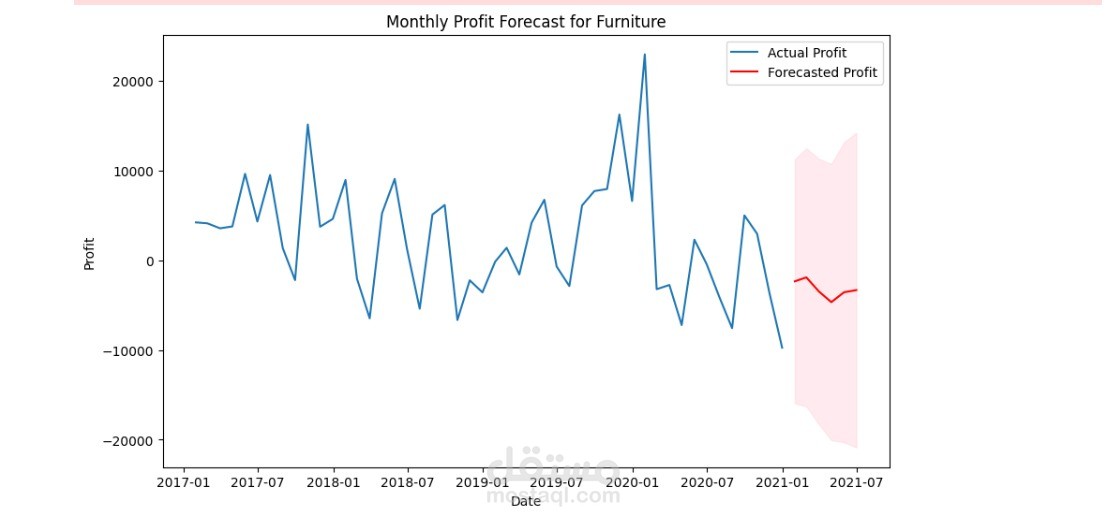
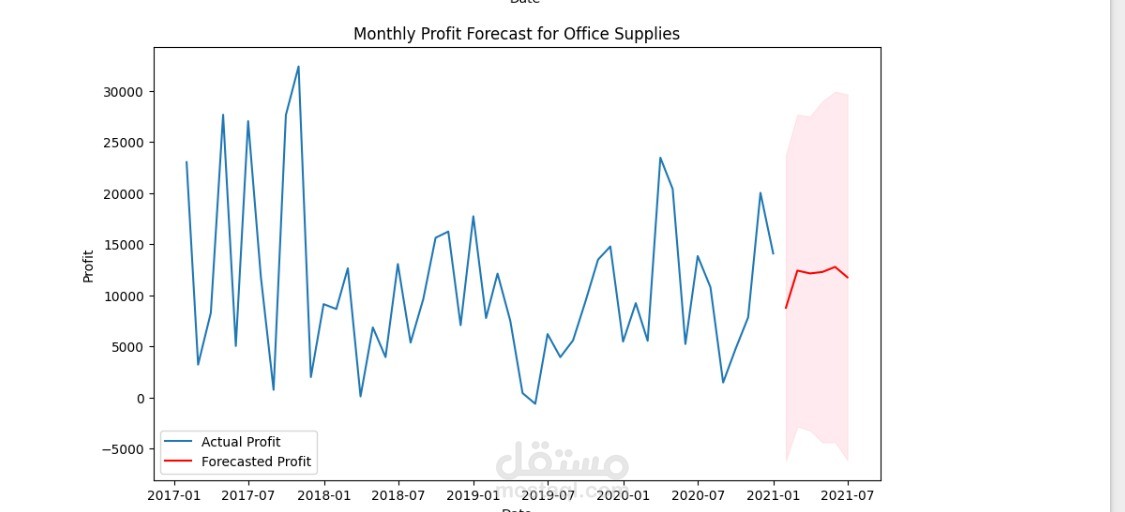
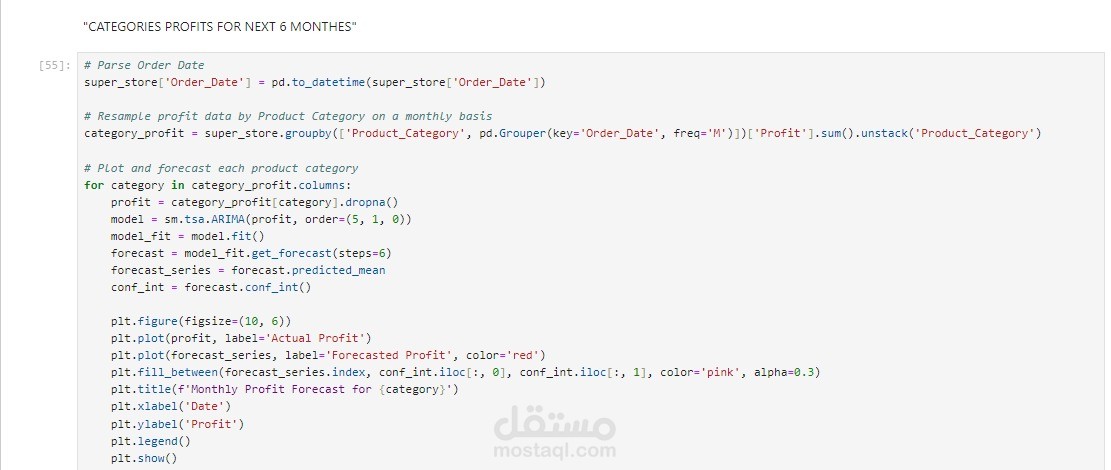
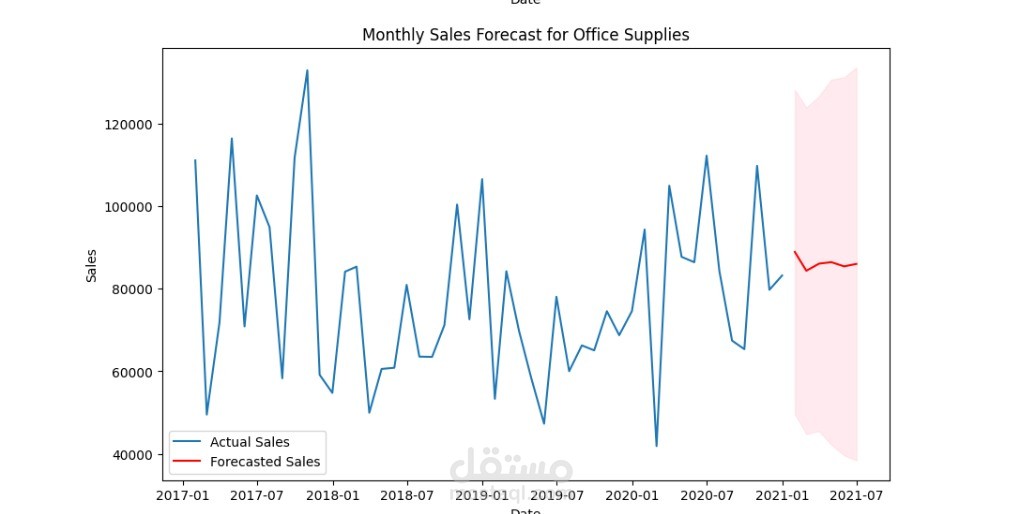
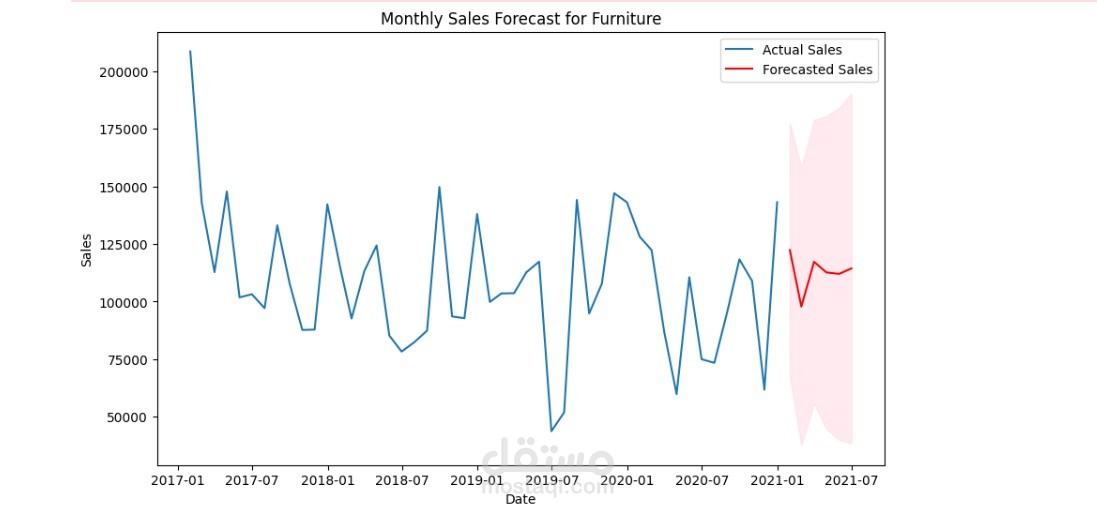
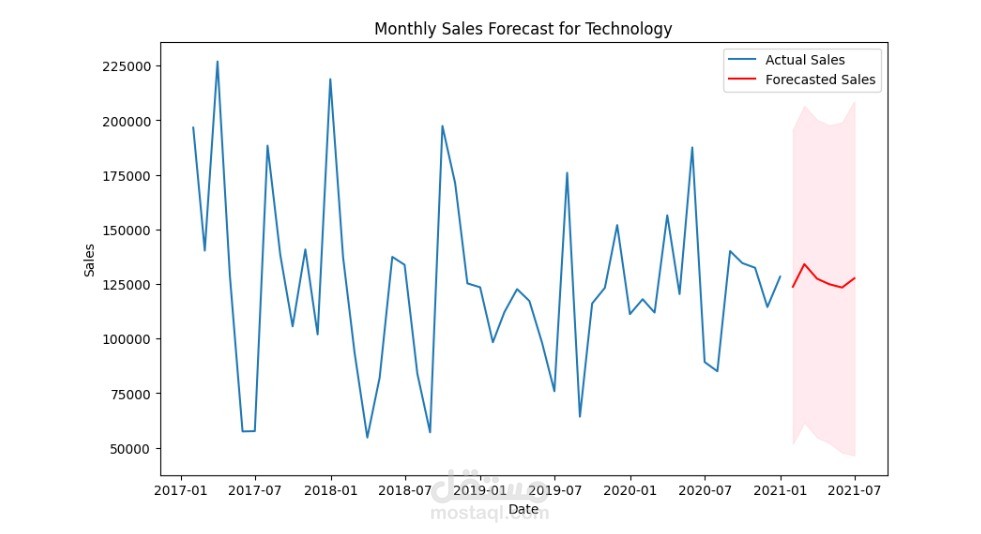
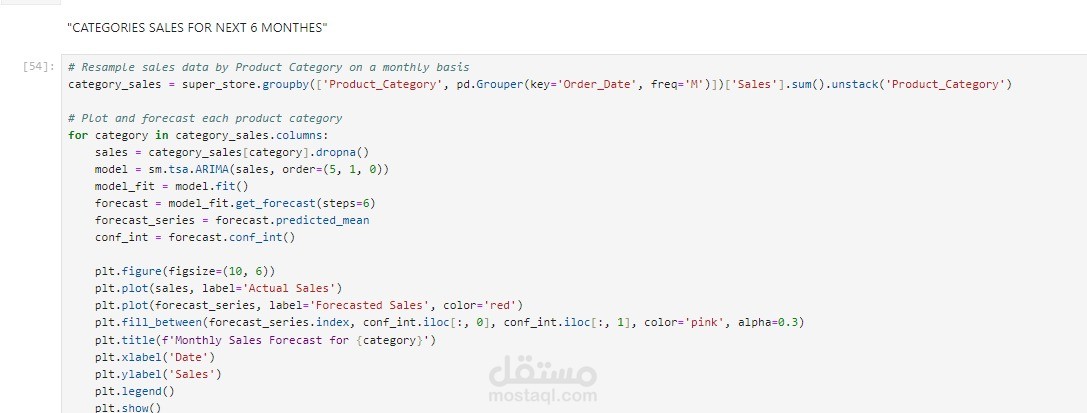
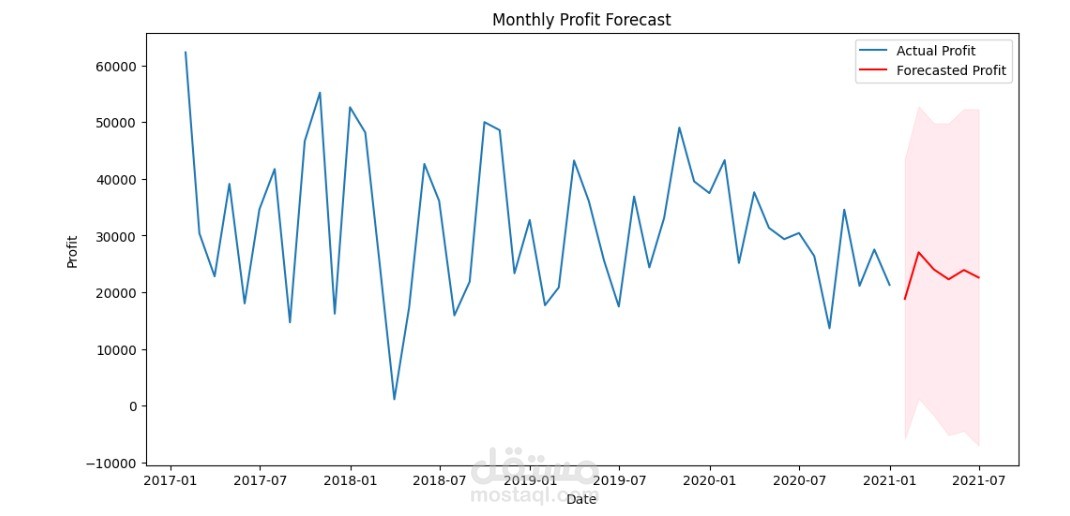
Forecasting Visualization
Tools Used:
SQL
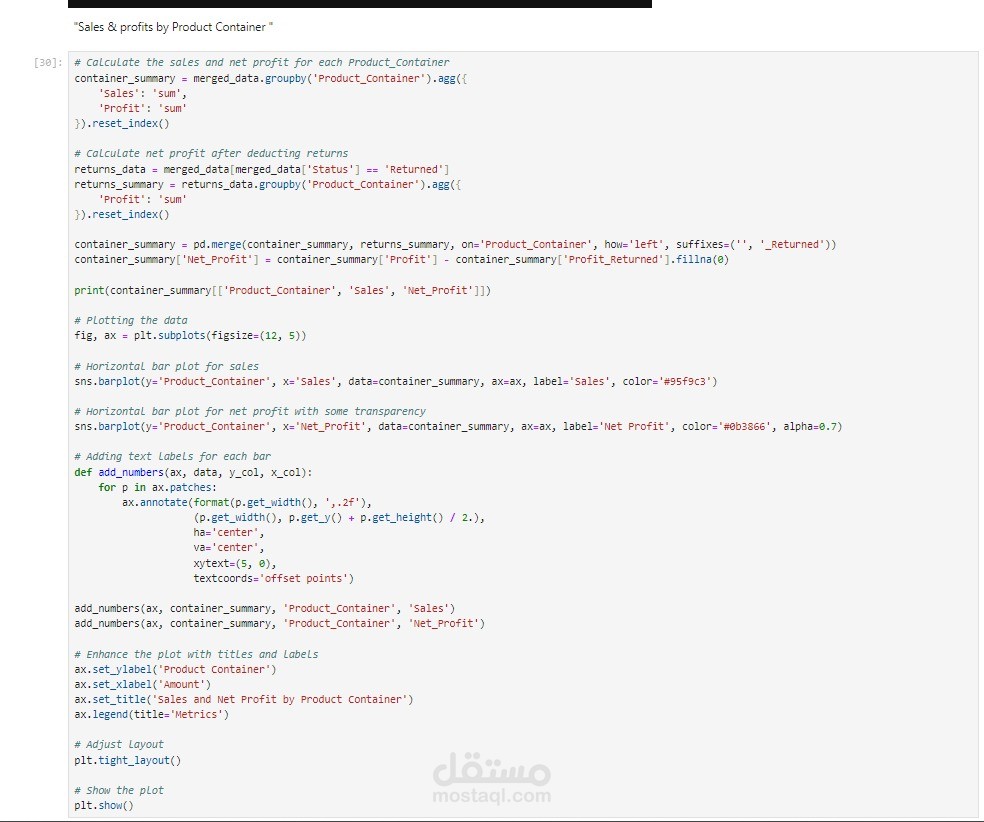
Pandas
NumPy
Matplotlib
Tableau
بطاقة العمل
| اسم المستقل | Ahmed H. |
| عدد الإعجابات | 0 |
| عدد المشاهدات | 8 |
| تاريخ الإضافة | |
| تاريخ الإنجاز |
