E-commerce in Egypt
تفاصيل العمل
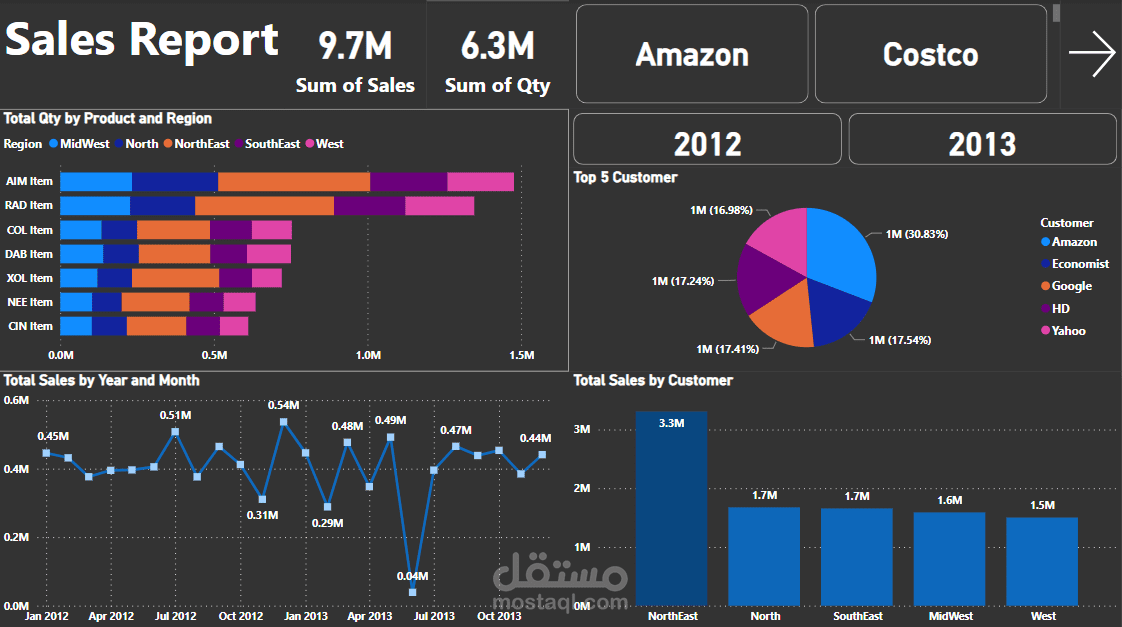
n the first dashboard, we analyze sales trends by region and customer, highlighting key metrics such as total sales and quantities across North America.
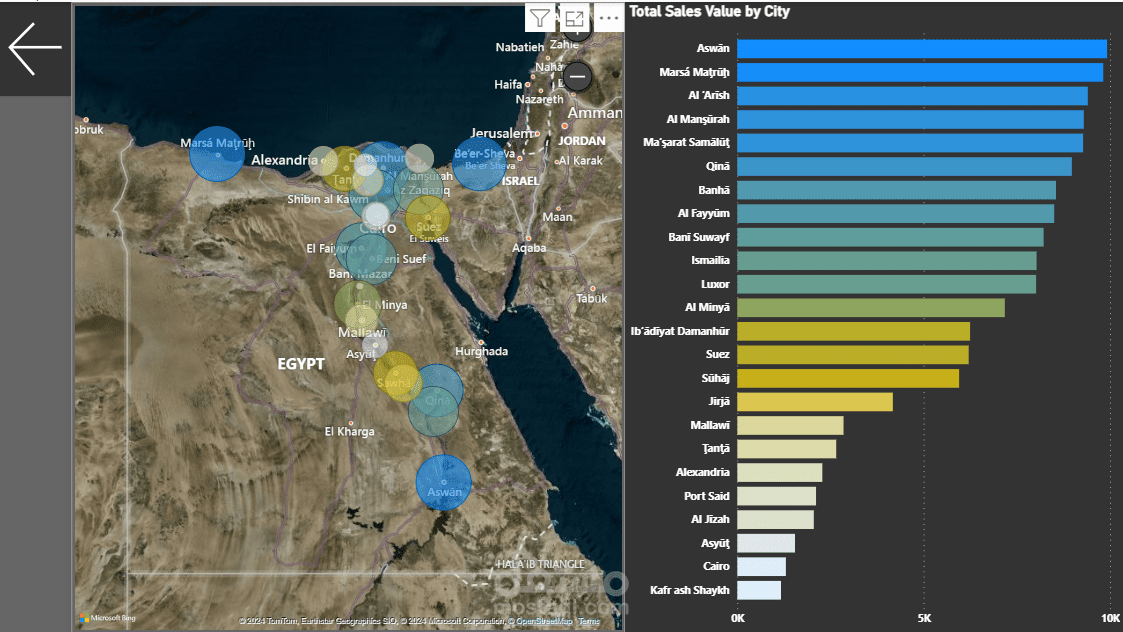
The second visualization provides a focused view of sales distribution across Egyptian cities, revealing top-performing locations such as Aswan and Marsá Maṭrūḥ.
These insights help pinpoint high-performing regions and identify areas for growth. Leveraging data visualizations like these enables better decision-making for strategic planning and market targeting.

