Sold Car Brands
تفاصيل العمل
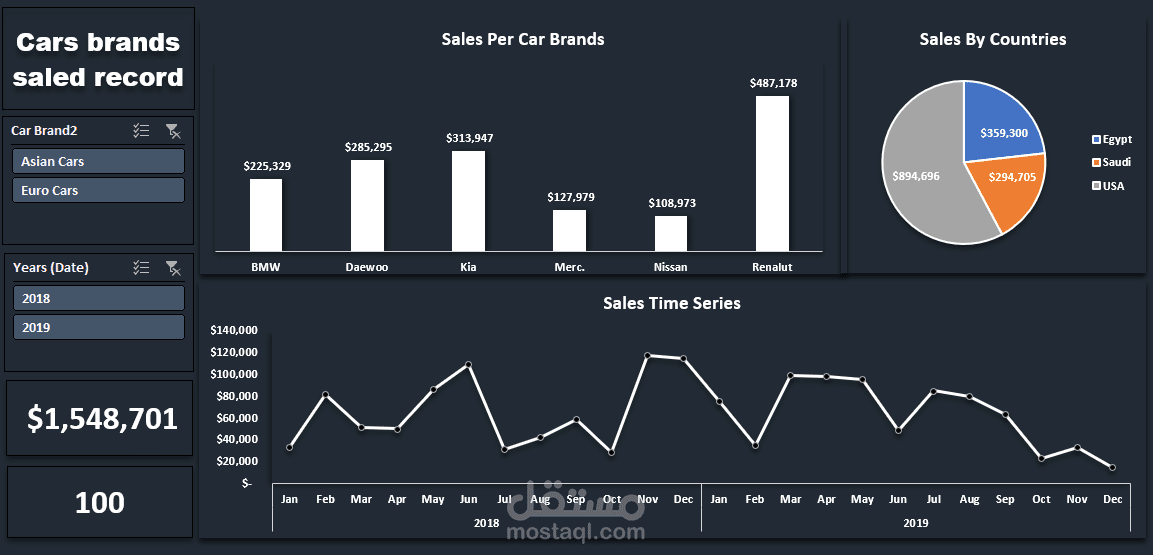
This dashboard, created using Excel and Pivot Tables, offers valuable insights into sales data from 2018 and 2019.
Key Highlights:
Total Sales: $1,548,701
Sales Per Car Brand:
Renault leads with $487,178.
Other top brands: Kia ($313,947), Daewoo ($285,295), BMW ($225,329).
Sales by Country:
USA: $894,696
Egypt: $359,300
Saudi Arabia: $294,705
Sales Over Time:
Trends for 2018-2019, showcasing peak performance in February and December.
This dashboard reflects my growing passion for data analysis and visualization. Each insight was derived with attention to detail and a focus on storytelling.
Tools Used: Excel and Pivot Tables.
