Comprehensive Sales Performance Dashboard Using Excel
تفاصيل العمل
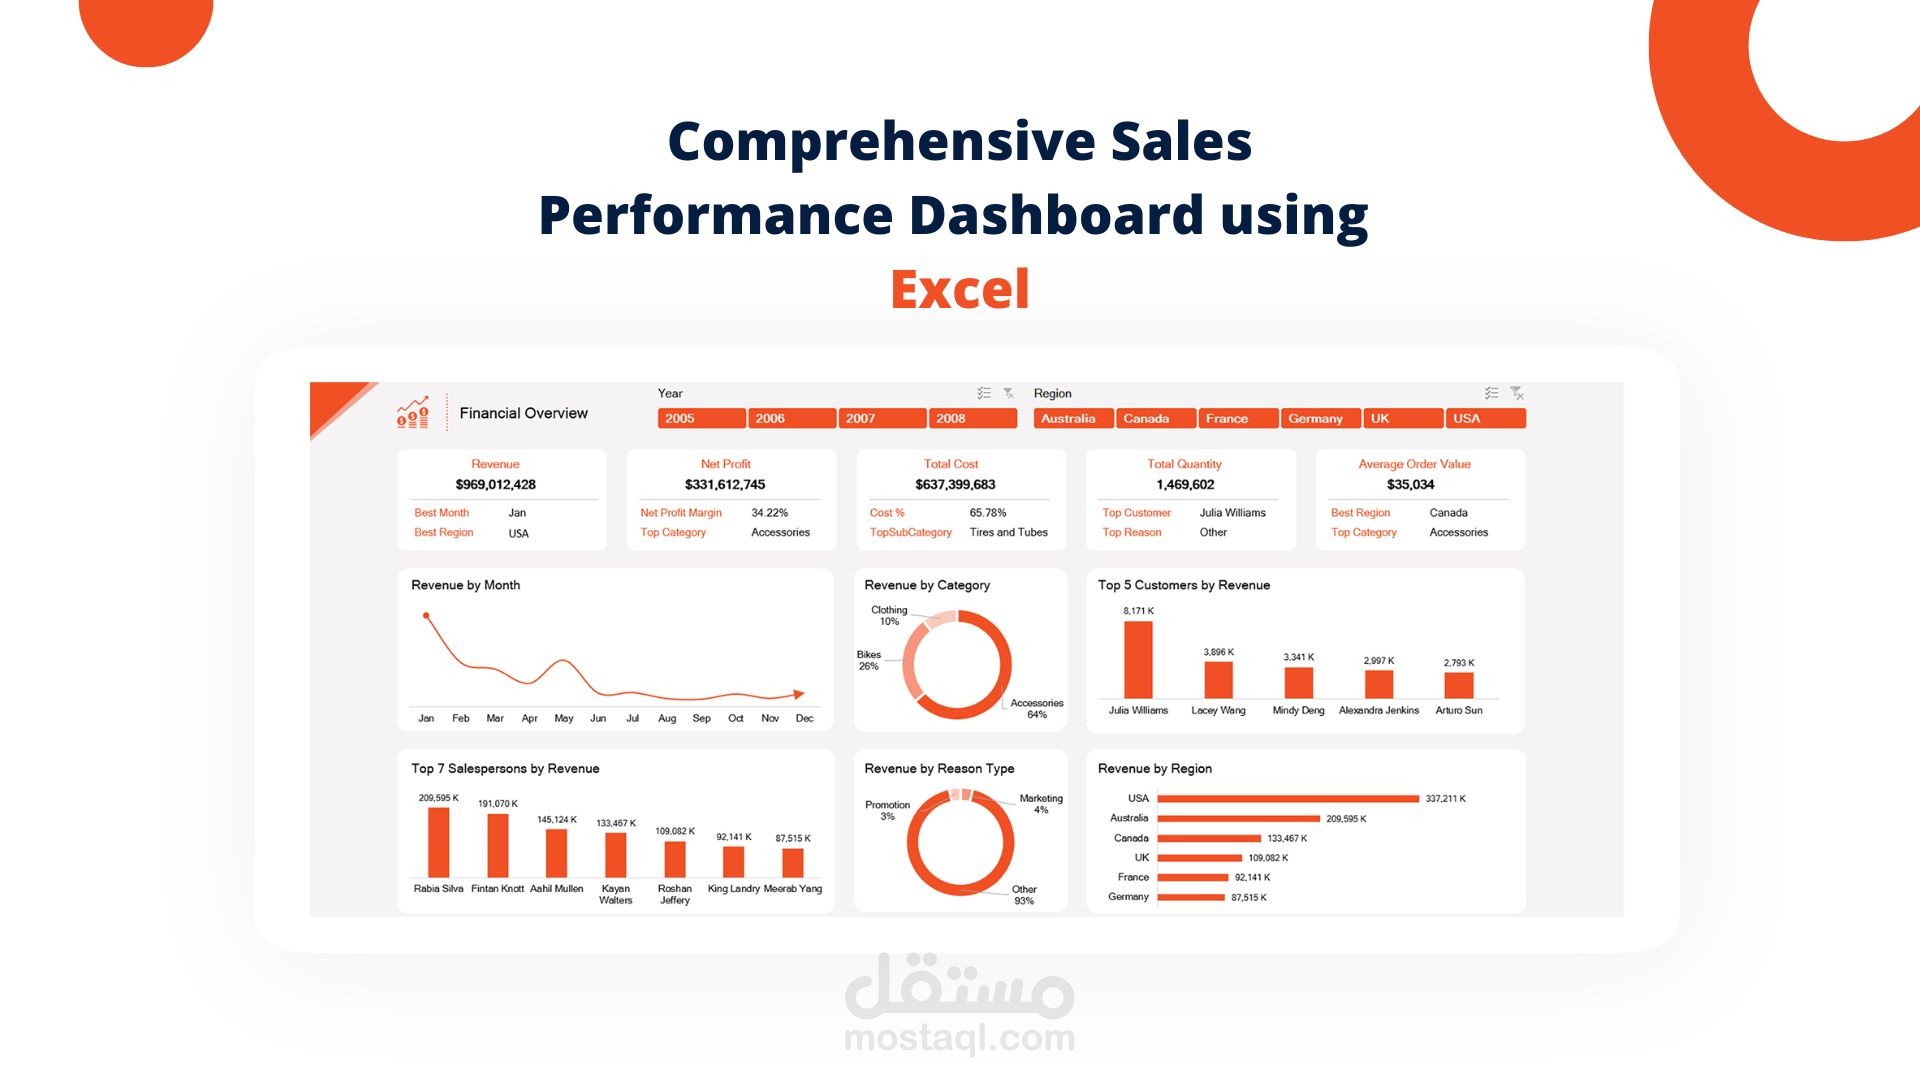
This project is my second Excel dashboard creation, a comprehensive Sales Dashboard designed to deliver key insights through dynamic KPIs and visuals. The dashboard provides a detailed financial overview, highlighting essential metrics.
Using tools like Power Query, Power Pivot, and DAX, I transformed raw data into meaningful visualizations, making complex information easy to interpret and actionable. This project showcases my skills in data modeling, analysis, and visualization within Excel.
️ The Journey to Building This Dashboard:
1️⃣ Data Transformation with Power Query
2️⃣ Data Modeling with Power Pivot: Established relationships and a robust data model.
3️⃣ Writing DAX for KPIs: Calculated metrics like Net Profit Margin , Cost % and etc.
4️⃣ Creating Pivot Tables: Organized data for analysis.
5️⃣ Gathering Visual Inspiration: Reviewed top dashboards for design ideas.
6️⃣ Sketching the Layout: Drafted the design on paper.
7️⃣ Final Dashboard Development: Built visuals and ensured the insights tell a story.
