Sales Report
تفاصيل العمل
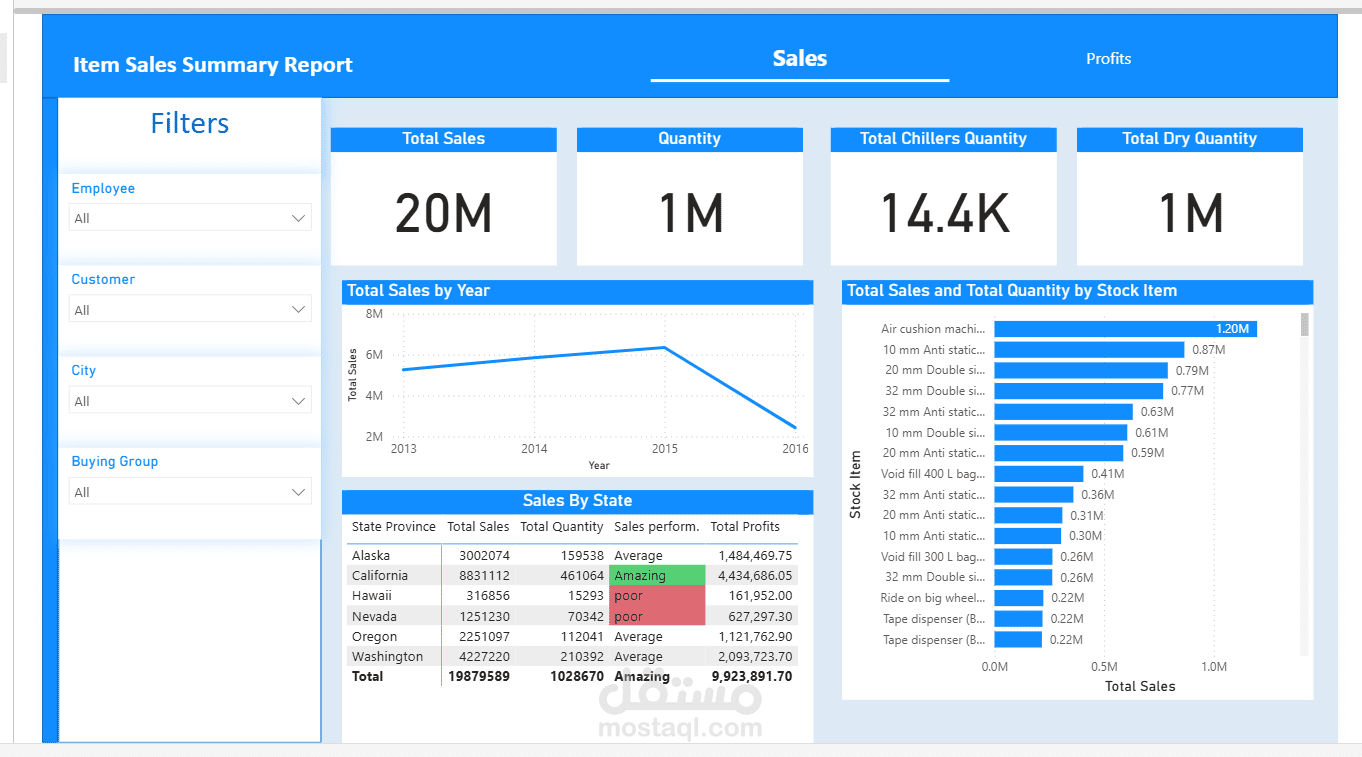
This project showcases an interactive and data-driven Power BI dashboard designed to analyze and visualize key performance indicators for item sales. The report is divided into two primary dashboards:
1_Sales Overview :
Displays total sales, quantities sold, and specific metrics such as the quantities of chilled and dry items. A trend chart illustrates total sales performance over the years. Sales performance by state is highlighted, providing insights into total sales, quantities, profits, and performance evaluation. Stock item analysis includes total sales and quantities for specific items, enabling targeted business decisions.
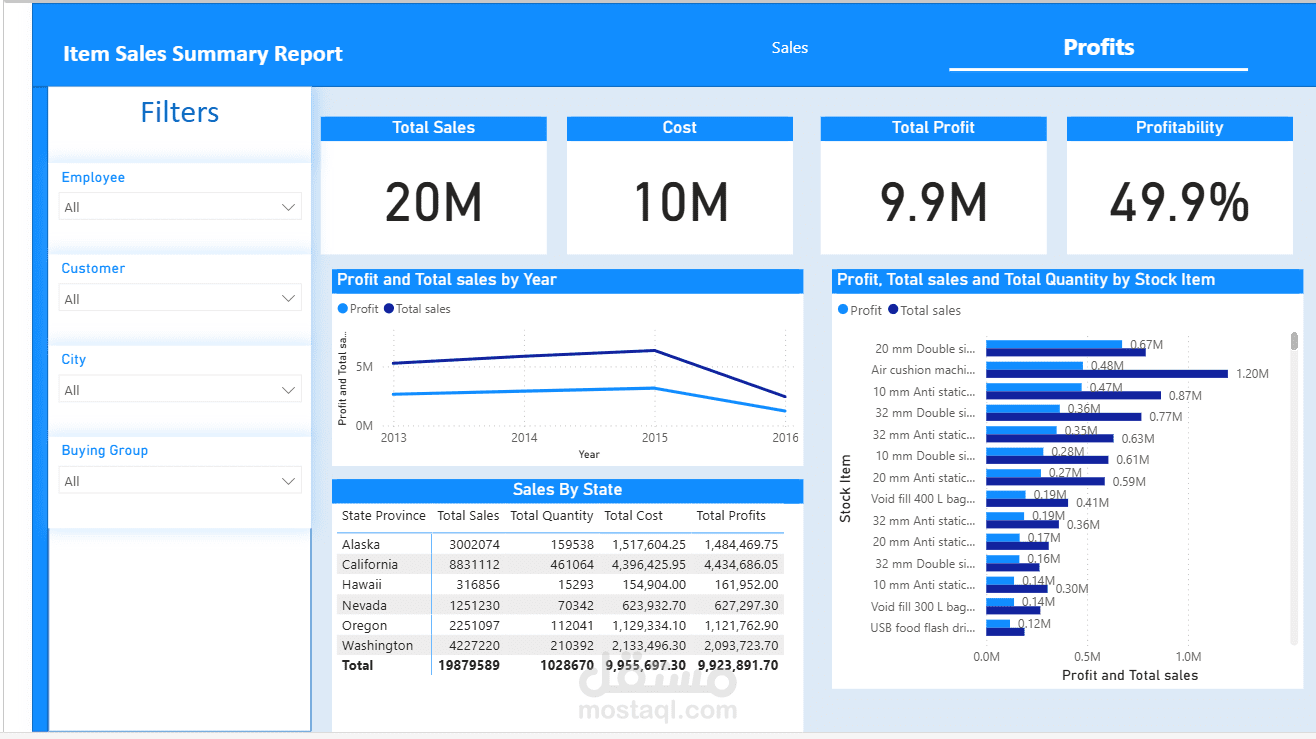
2_Profit Overview :
Provides a summary of total profit, cost, and profitability percentage. A trend chart tracks profit and total sales by year. State-level profitability is detailed, offering a breakdown of sales, costs, and profits across regions. A stock item analysis highlights the profit and sales distribution, aiding in profitability optimization.