Sales Performance Dashboard (Excel | Pivot Tables )
تفاصيل العمل
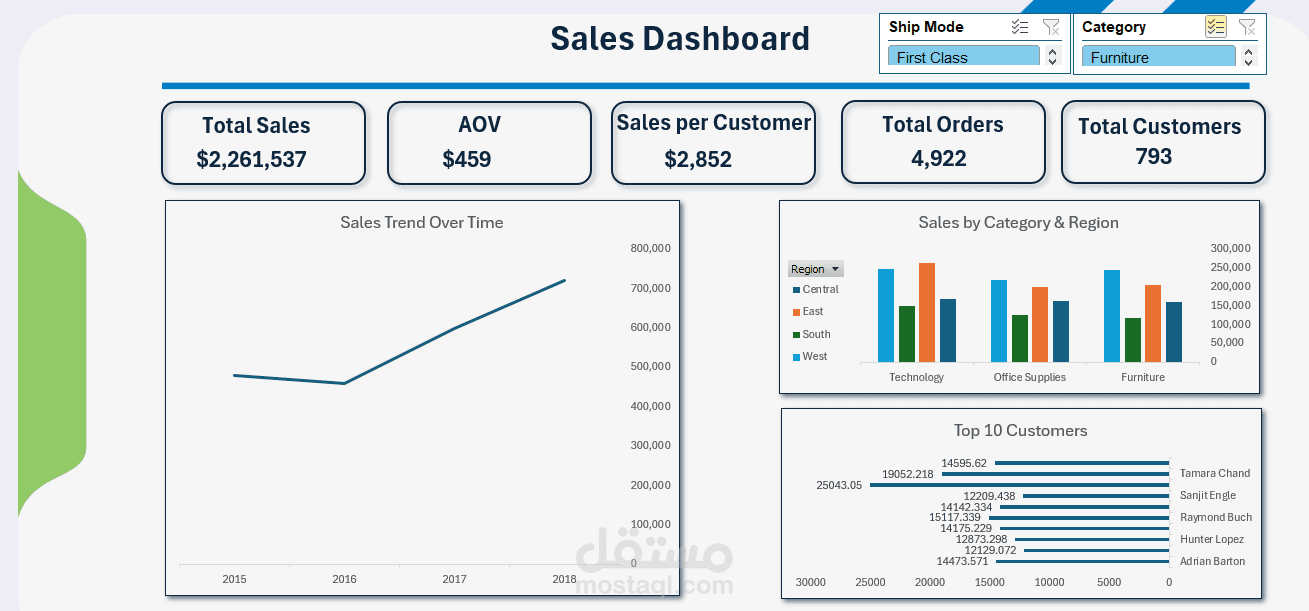

This project presents an interactive Sales Performance Dashboard built using Excel, based on the Superstore Sales dataset.
The dashboard provides a high-level overview of sales activity, customer metrics, and performance trends to support business decision-making.
? Objectives
Analyze overall sales performance
Track sales trends over time
Evaluate customer purchasing behavior
Compare sales across categories and regions
Identify top-performing customers
? Tools & Techniques
Microsoft Excel
Pivot Tables
KPI Design
Data Visualization
Interactive Filters (Slicers)
? Key Metrics (KPIs)
Total Sales
Total Orders
Average Order Value (AOV)
Sales per Customer
Total Customers
? Dashboard Features
✔ Sales Trend Over Time
✔ Sales by Category & Region
✔ Top 10 Customers
✔ Interactive Filters (Ship Mode, Category)
? Key Insights
Sales show consistent growth from 2016 onward
Technology category generates the highest sales
West region demonstrates strong performance
A small group of customers contributes significantly to revenue