Refugee Needs Analysis Dashboard
تفاصيل العمل
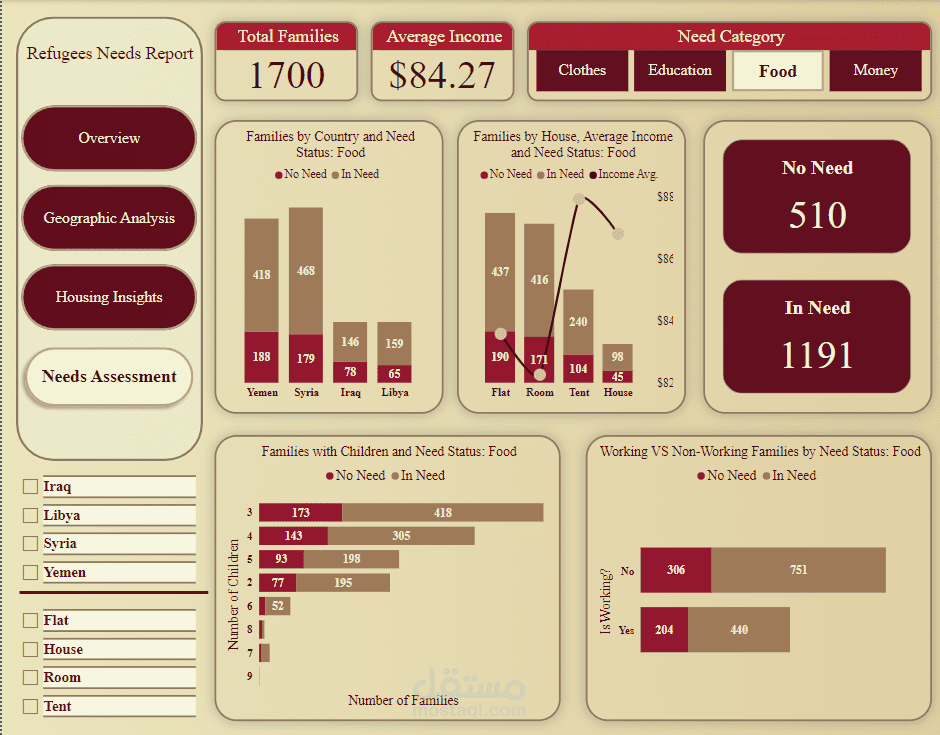
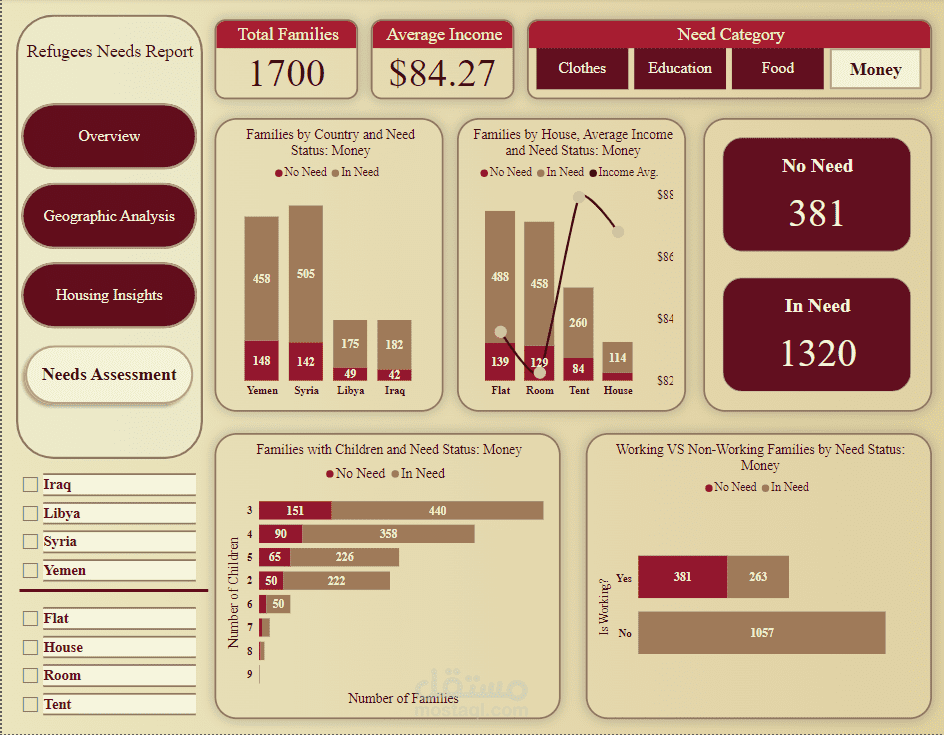
I developed a dynamic Refugee Needs Analysis Dashboard using Power BI, Excel, Power Query, and DAX, providing insights into refugee demographics, needs, and living conditions to support data-driven decisions.
Dashboard Highlights:
-Overview Page: Summarizes total families, average income, gender ratio, working status, family sizes, and breadwinner distribution.
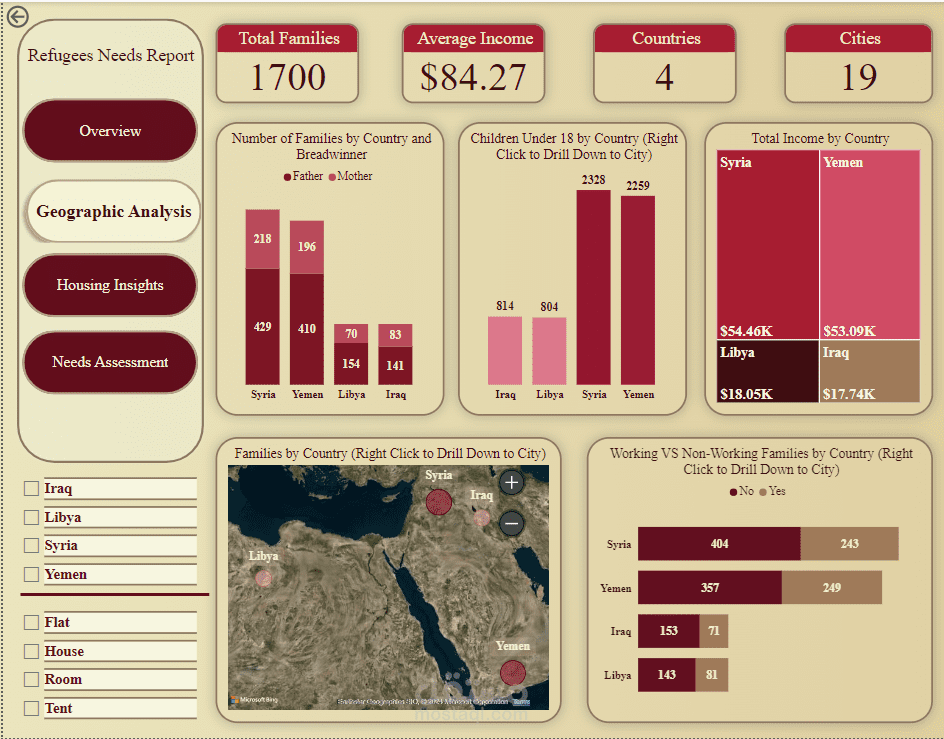
-Geographic Analysis: Maps refugee distribution by country, city, breadwinner type, and working status, showing income and child demographics.
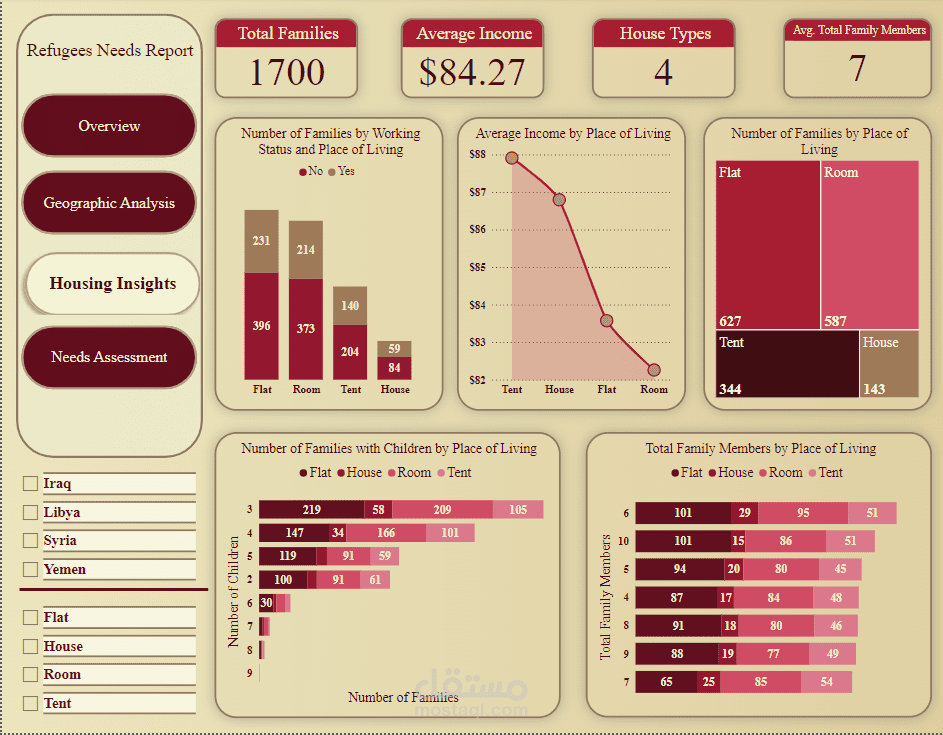
-Housing Insights: Analyzes family size, income, and children’s presence by housing type, including flats, houses, and tents.
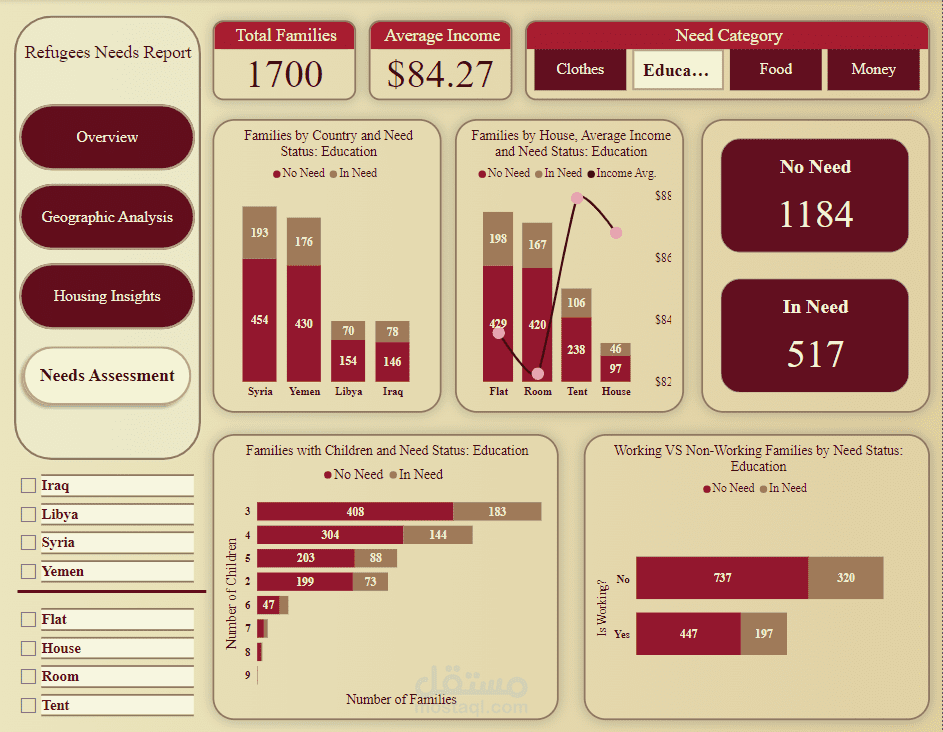
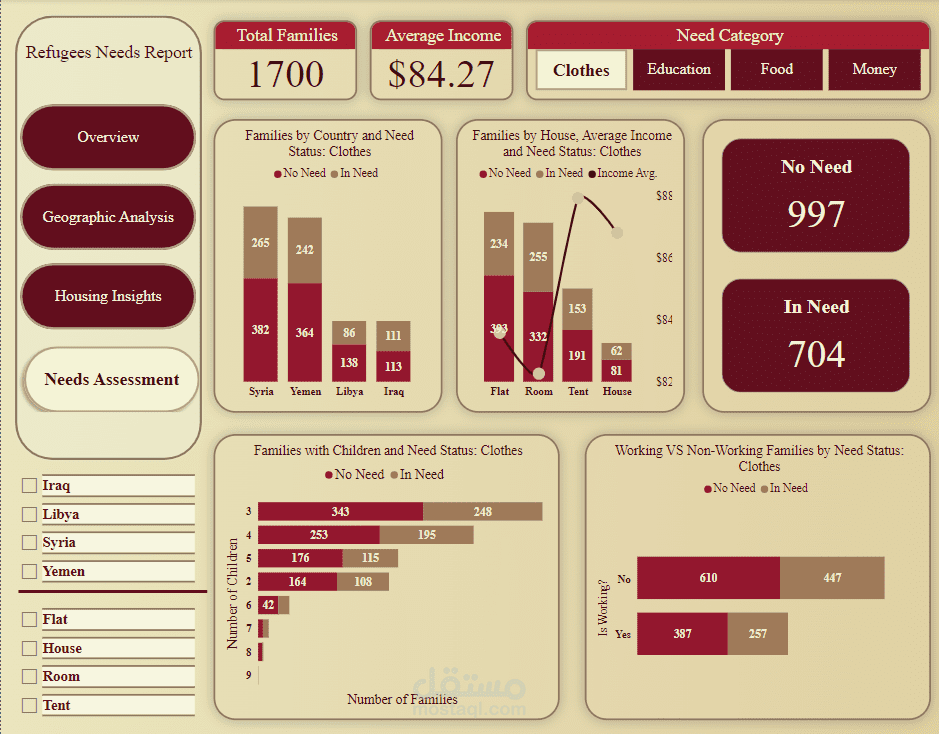
-Needs Assessment: Highlights financial, food, housing, and education needs for resource prioritization.
Key Insights:
-Male-to-female ratio is 54.68% to 45.32%, with fathers as breadwinners in 66.7% of families.
-Families with 6–8 members are most common, with income varying significantly by size.
-Syria and Yemen have the largest families, while Libya and Iraq show lower family counts.
-Flats house most families, while tents accommodate the lowest-income groups.
-Over 60% of refugee families are non-working, requiring urgent economic support.
This dashboard offers actionable insights for strategic resource allocation and addressing key challenges.
ملفات مرفقة
بطاقة العمل
| اسم المستقل | Haneen H. |
| عدد الإعجابات | 0 |
| عدد المشاهدات | 4 |
| تاريخ الإضافة | |
| تاريخ الإنجاز |

