Born Digital Data Analysis Dashboard
تفاصيل العمل
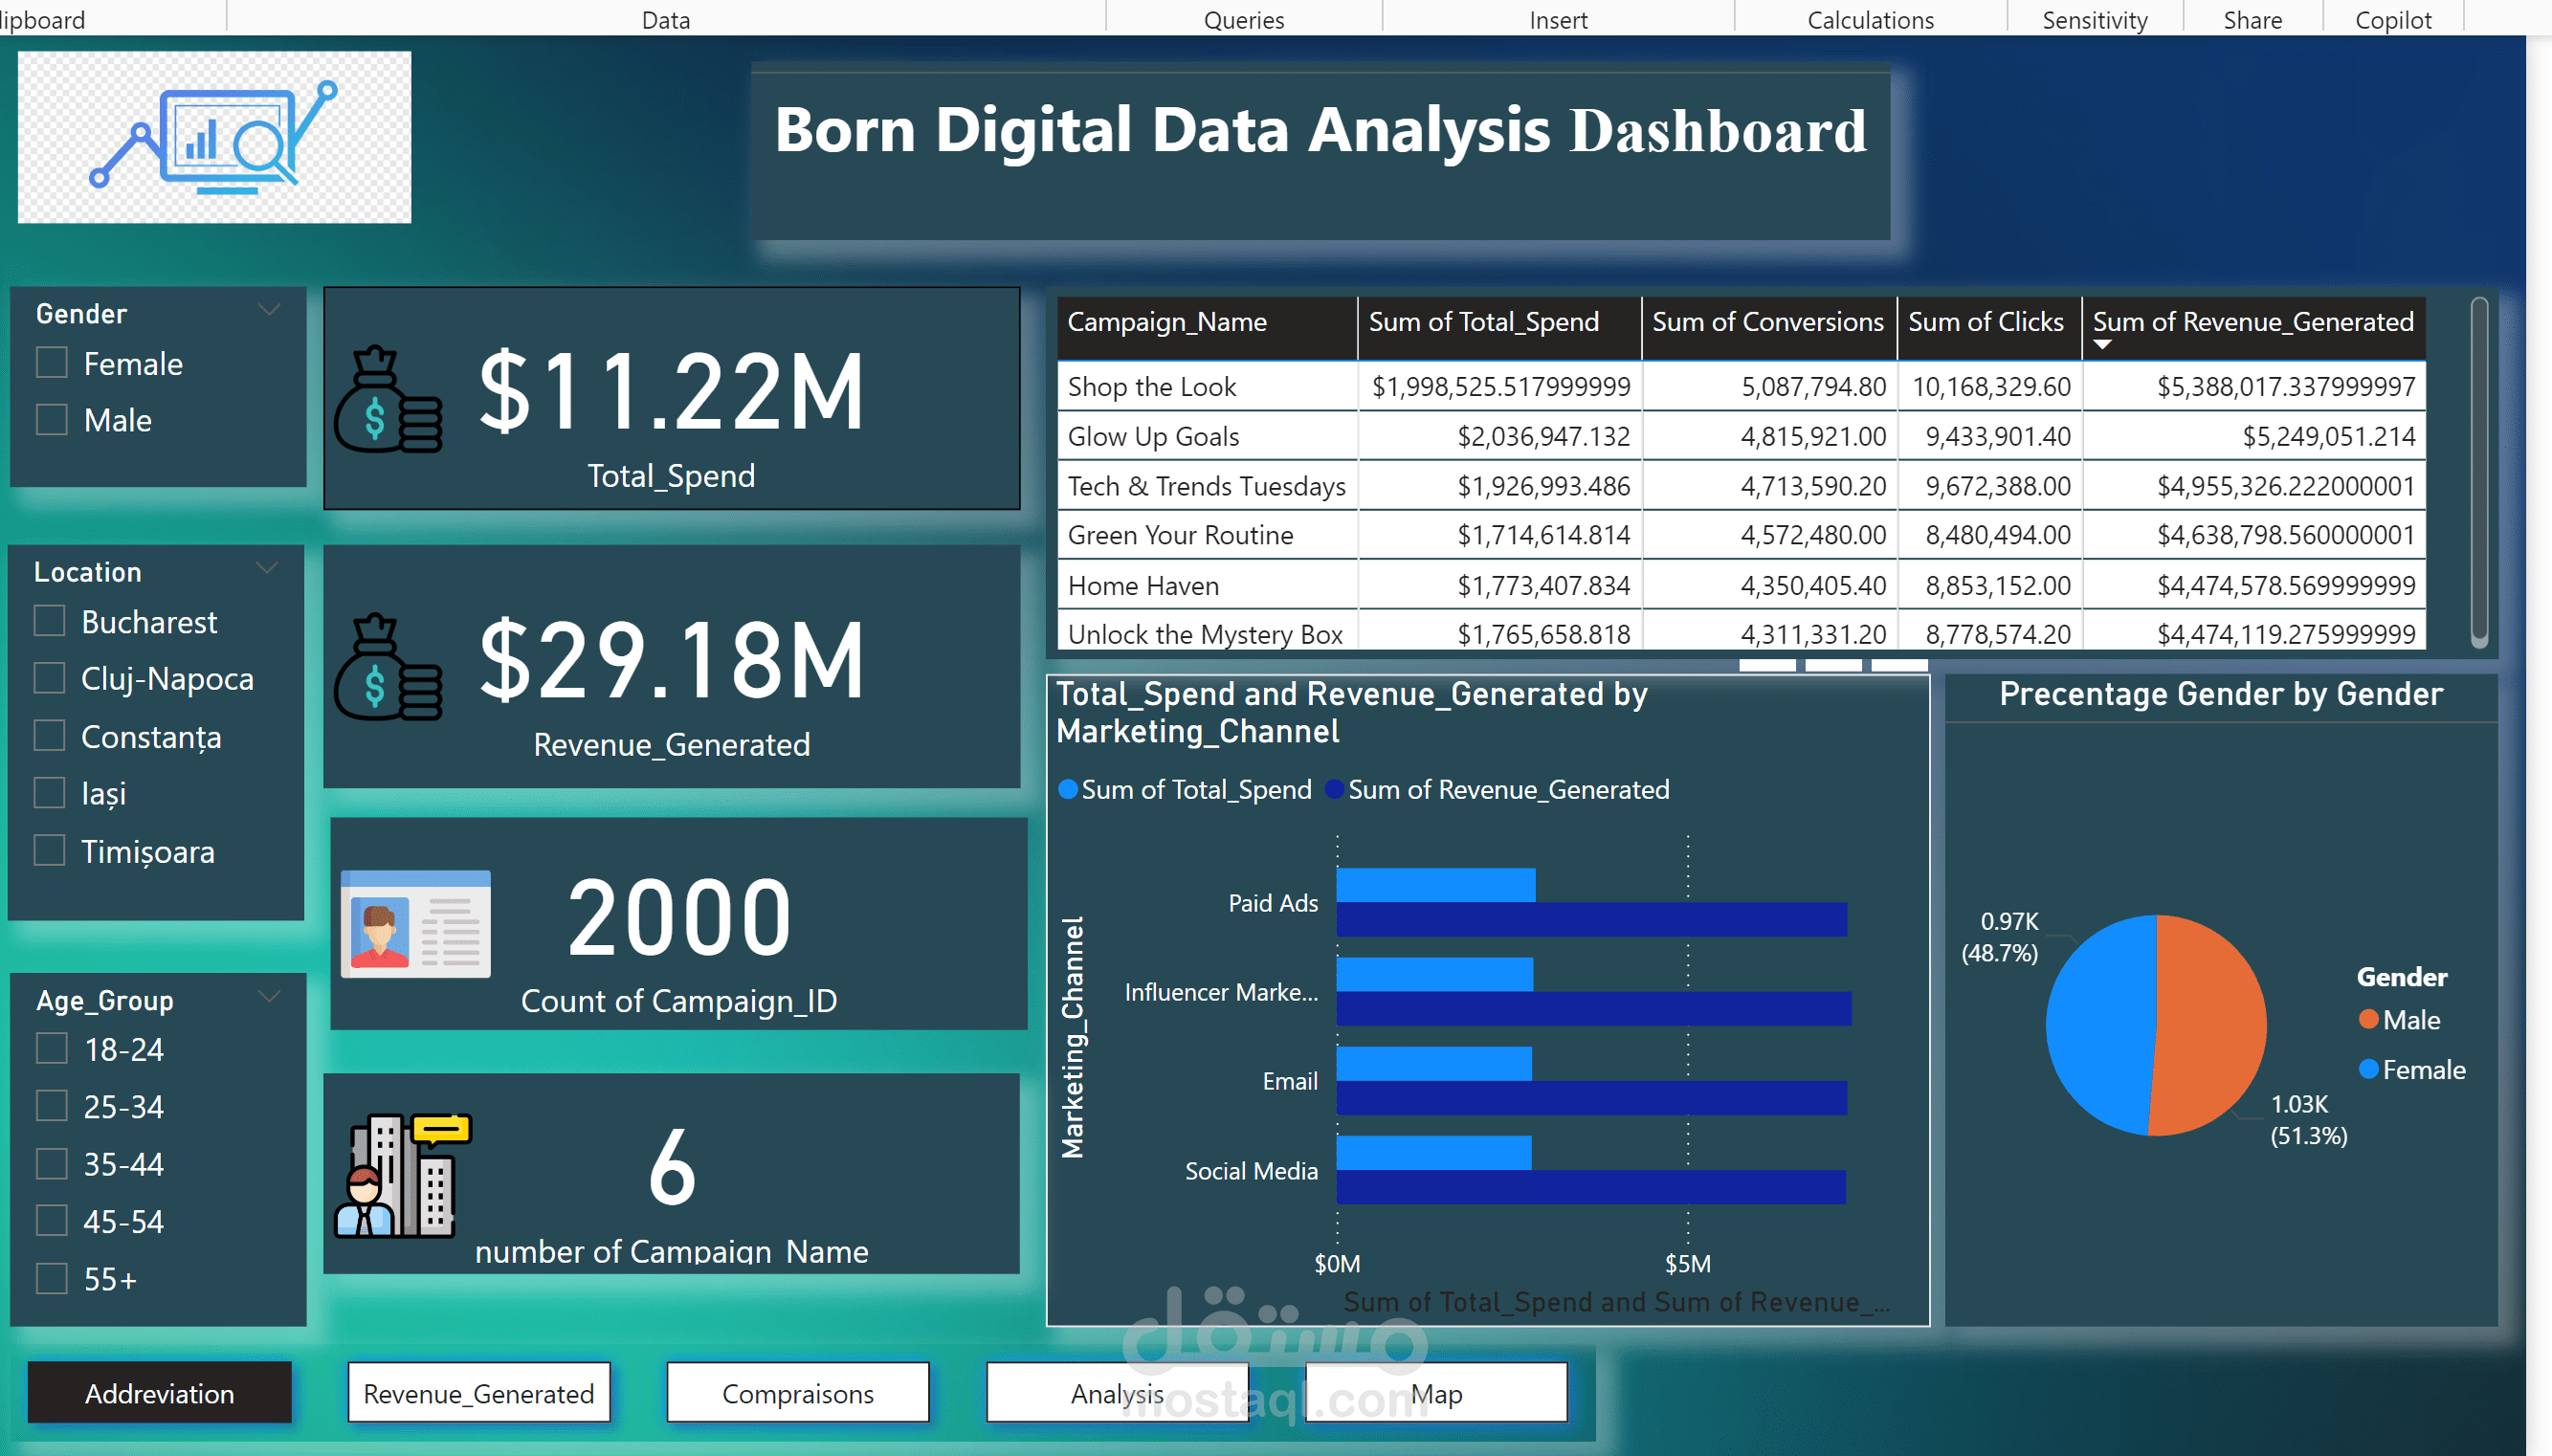
●KPIs Summary: Include total impressions, total clicks, total conversions, total spend, total revenue, average CTR, and ROAS.
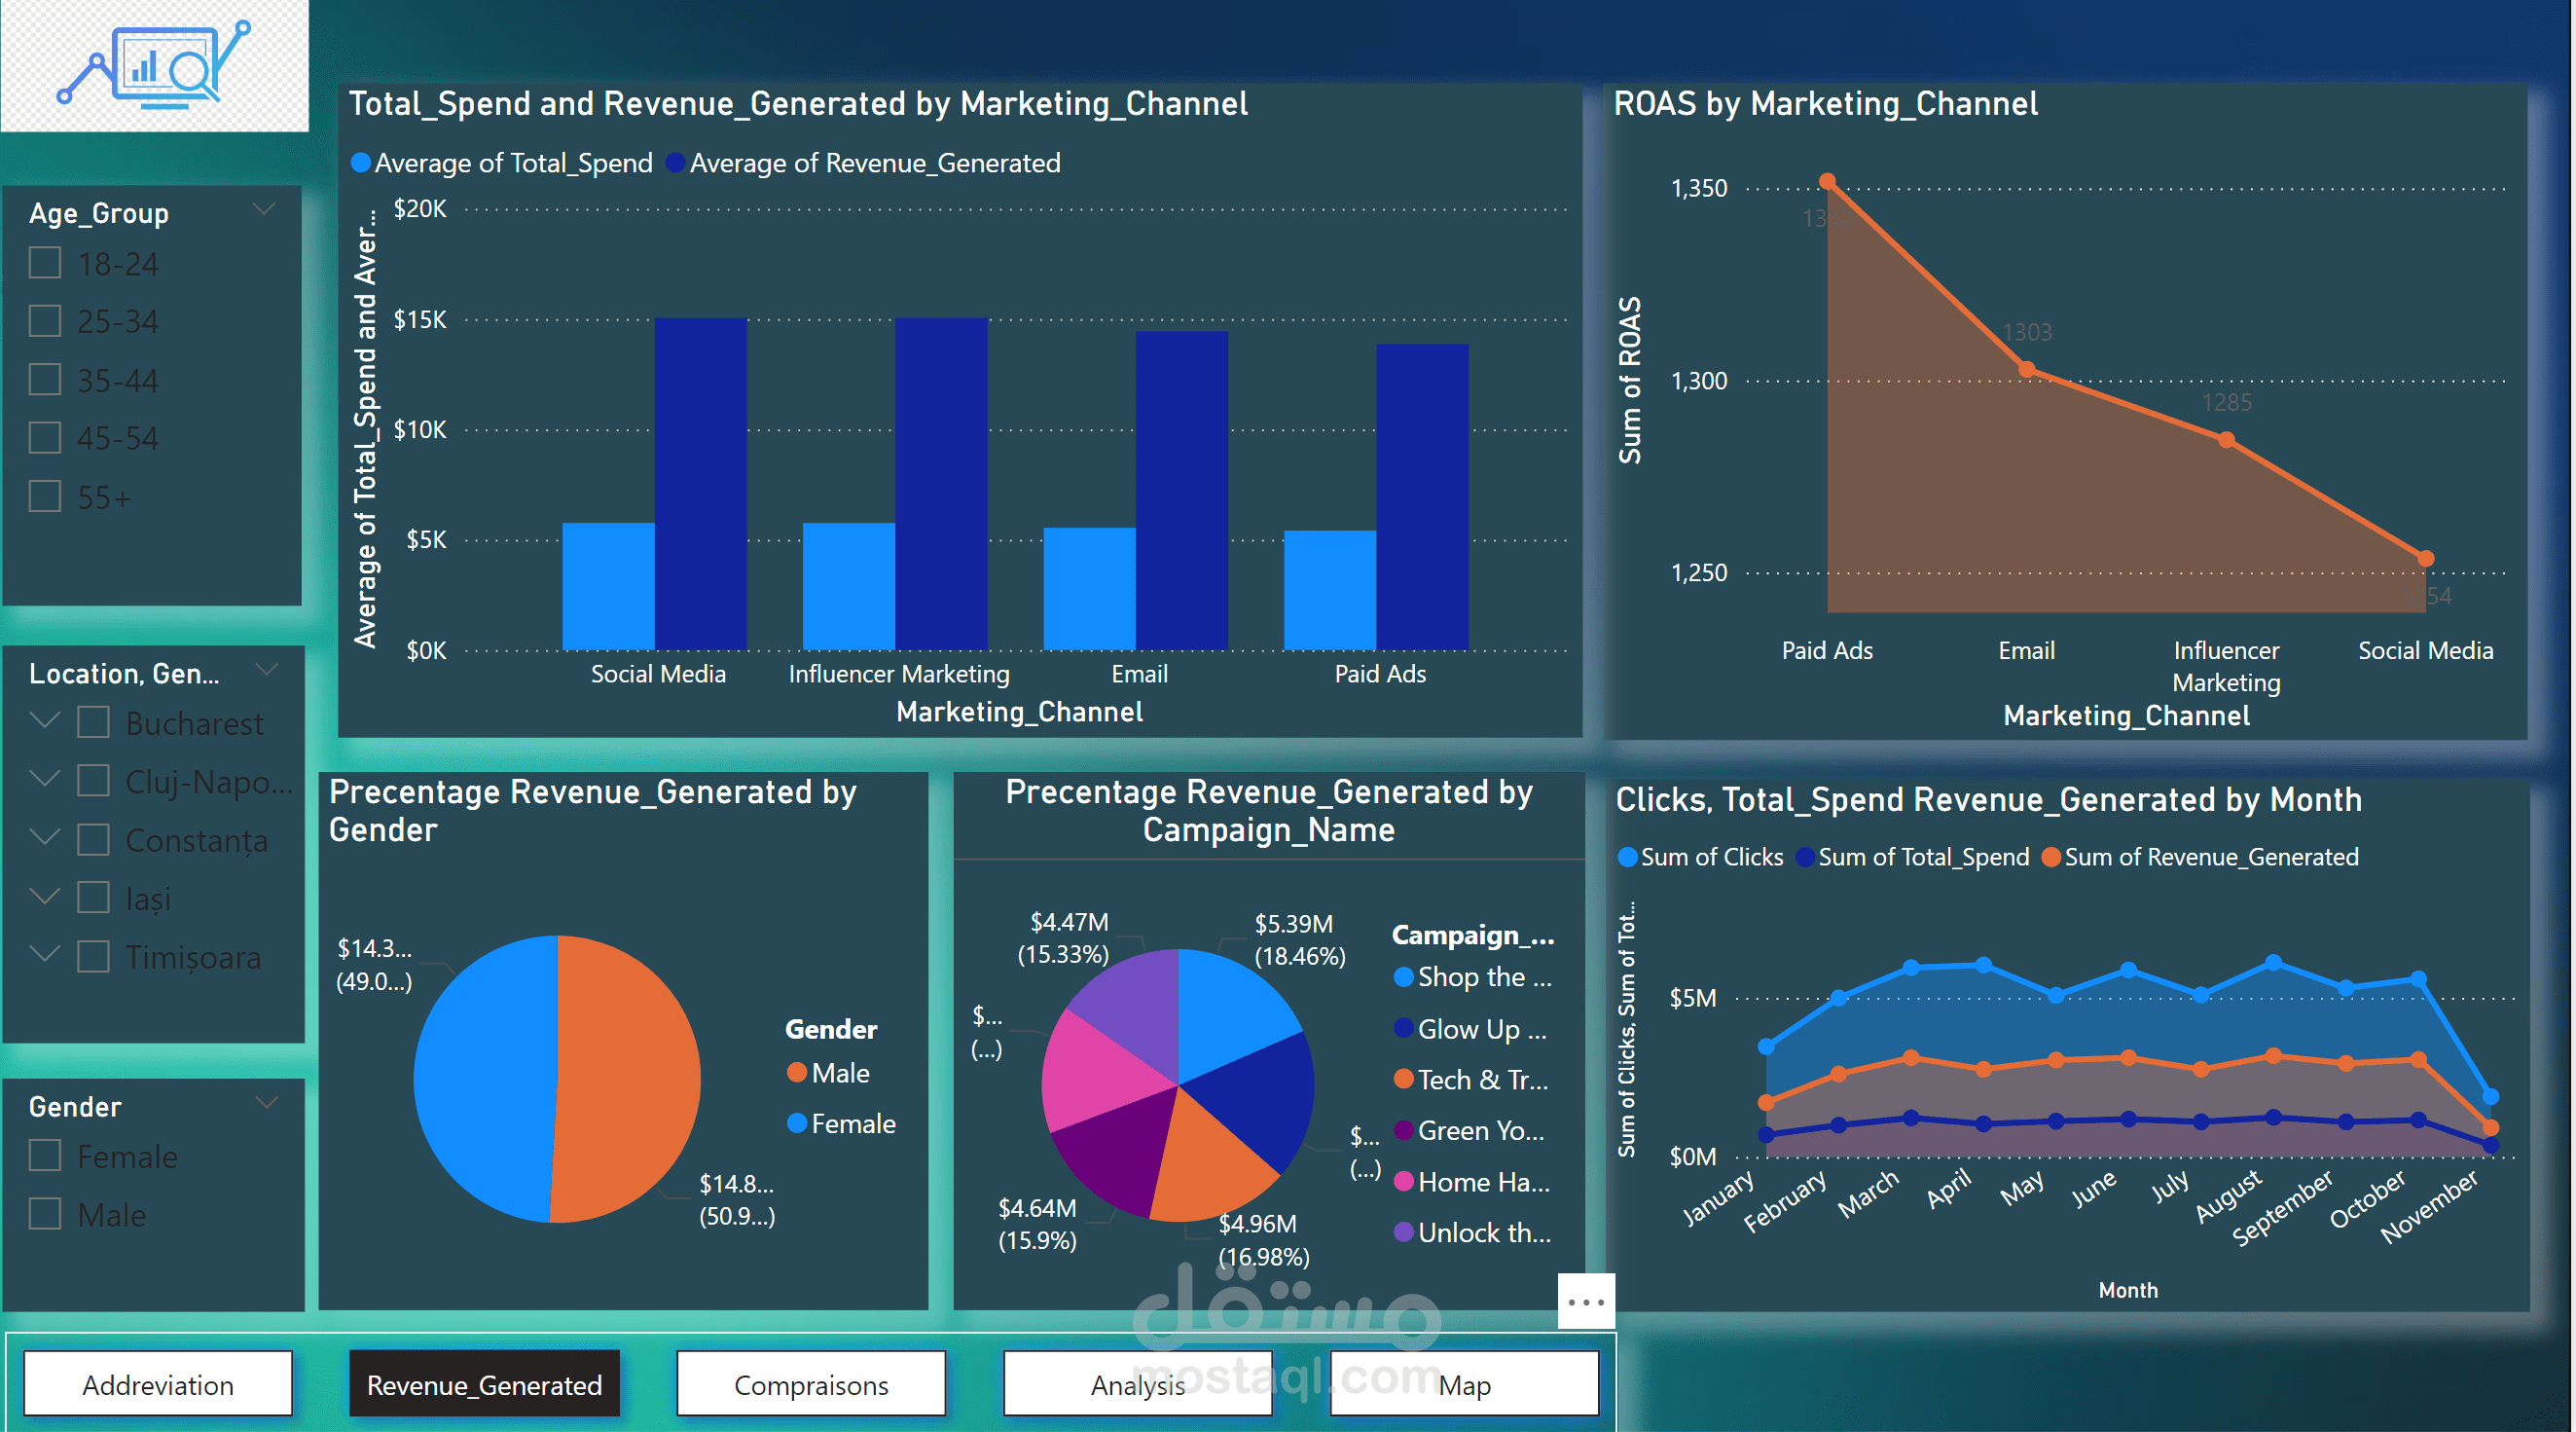
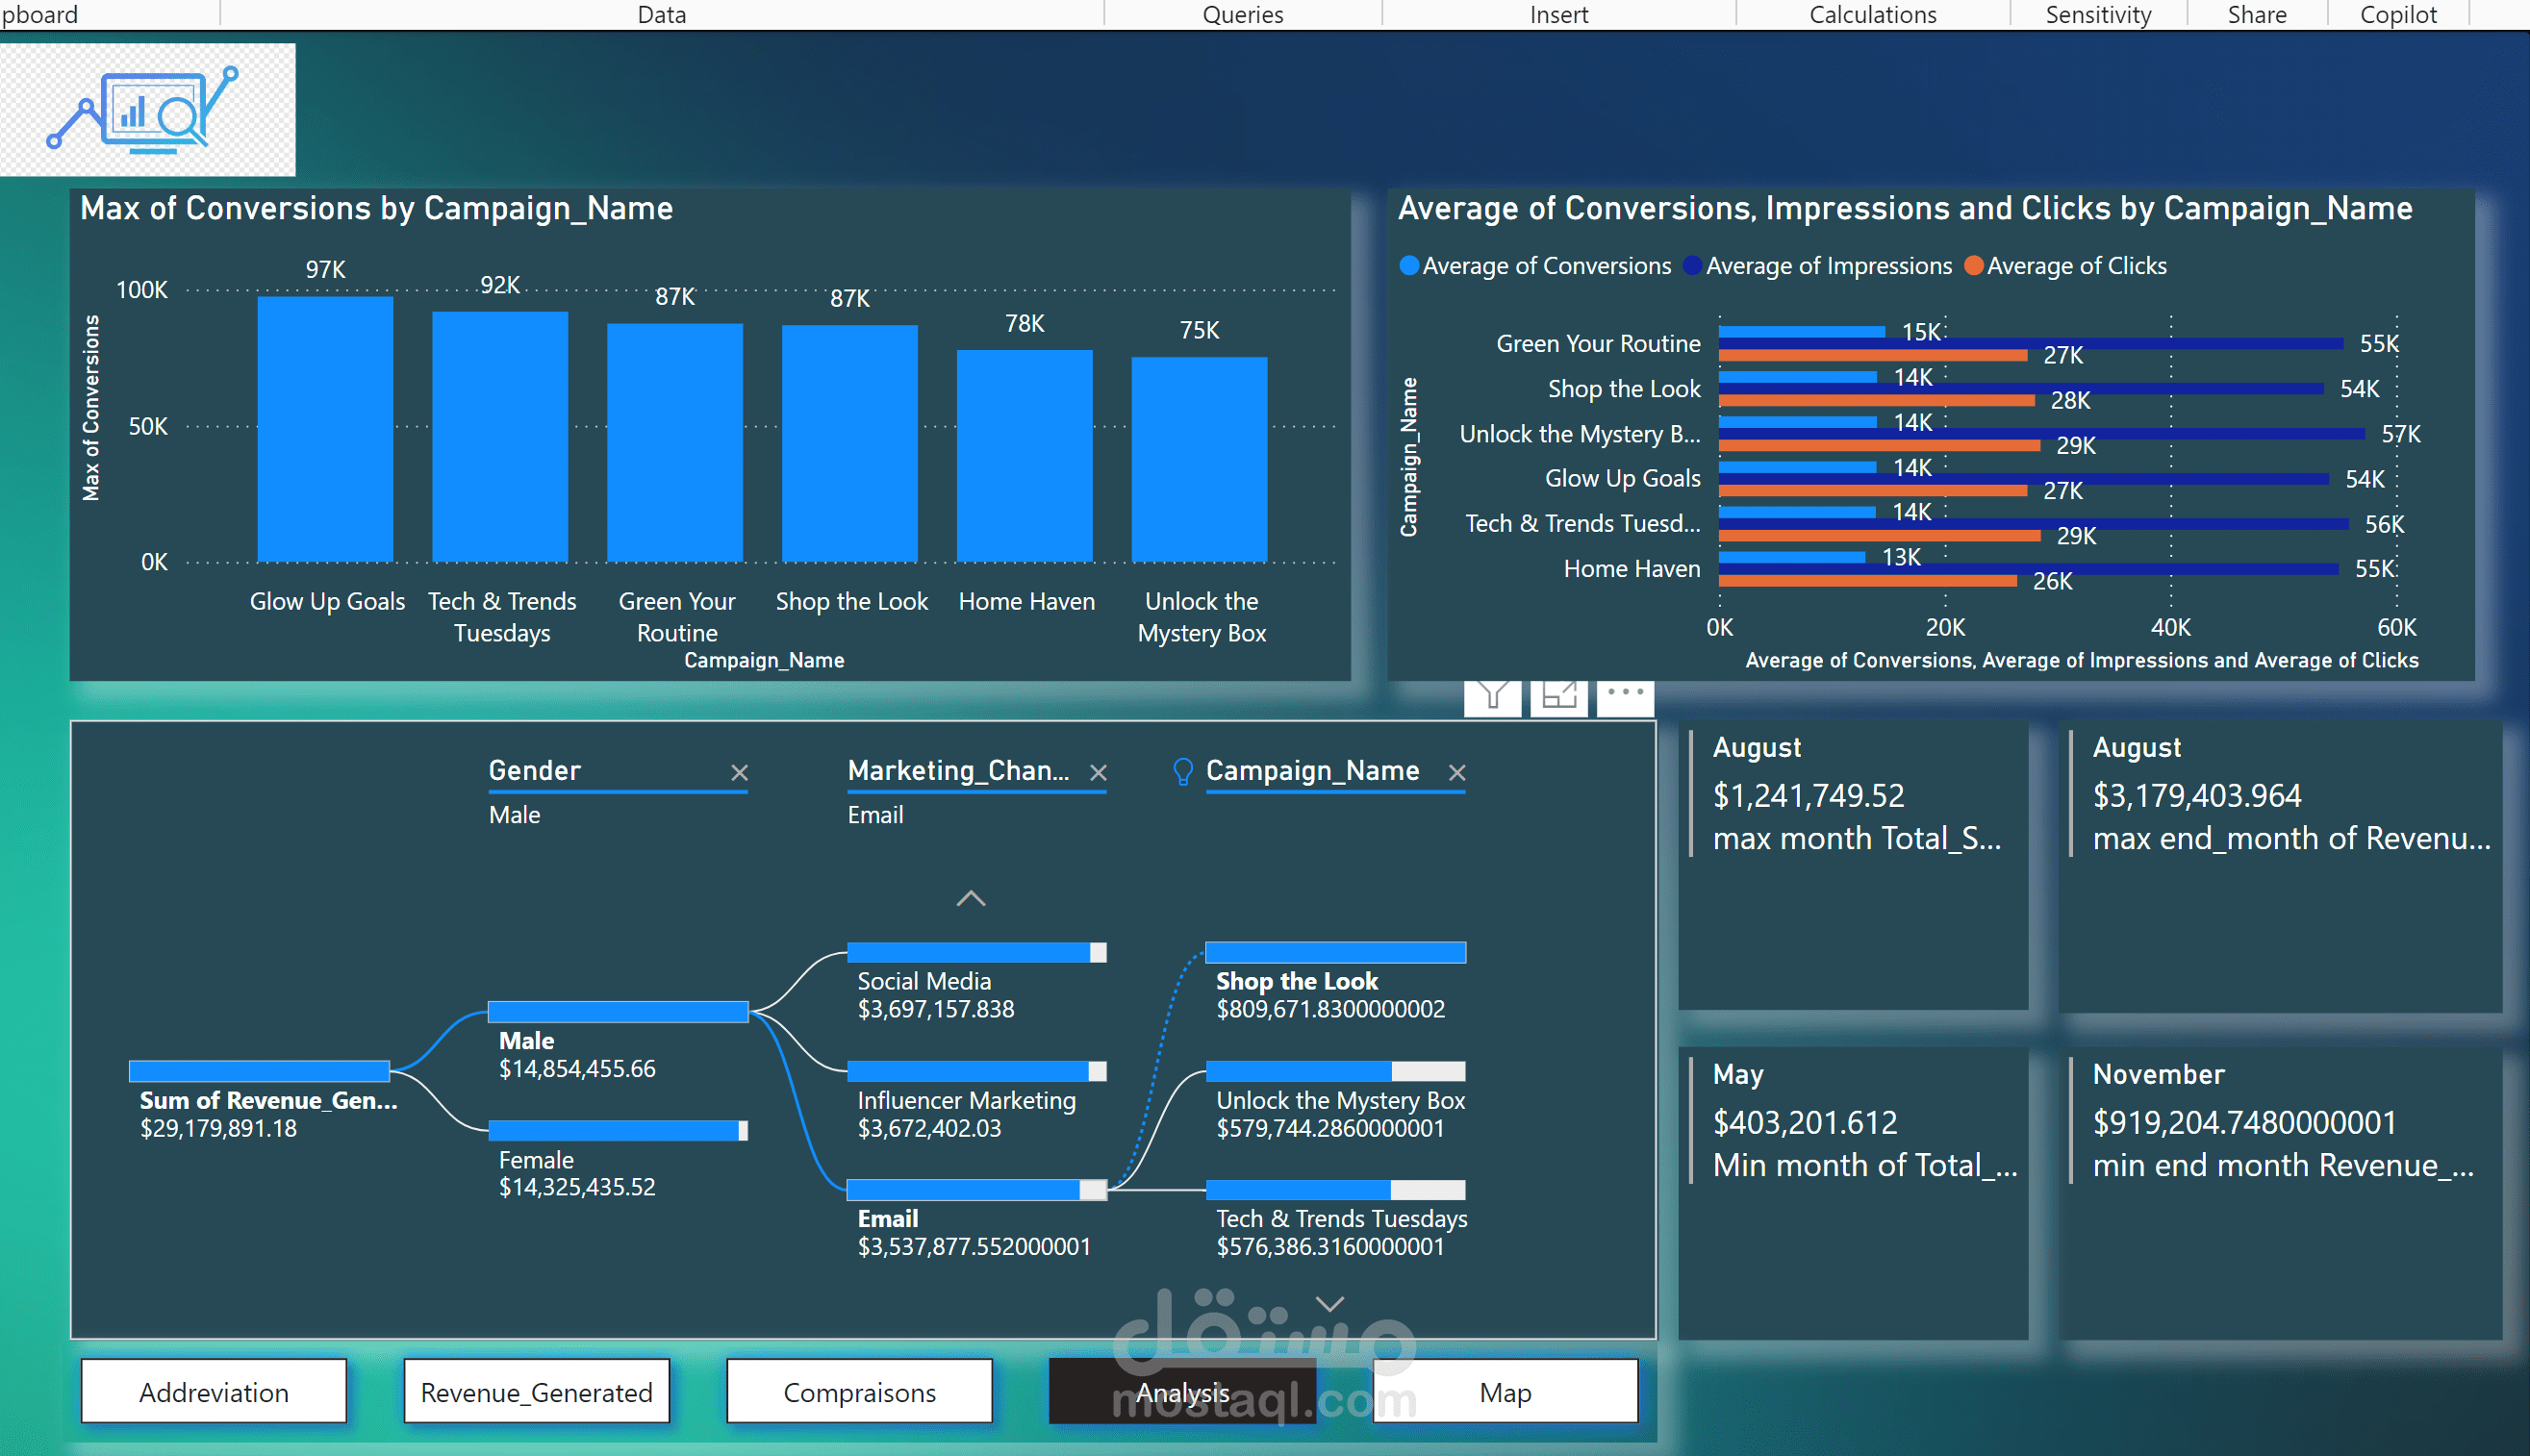
●Campaign Performance Overview: Bar or line charts comparing key metrics (CTR, conversion rate, ROAS) across campaigns.
●Channel Performance Breakdown: Visualization (e.g., pie or stacked bar chart) to show distribution of total spend, impressions, and conversions by channel.
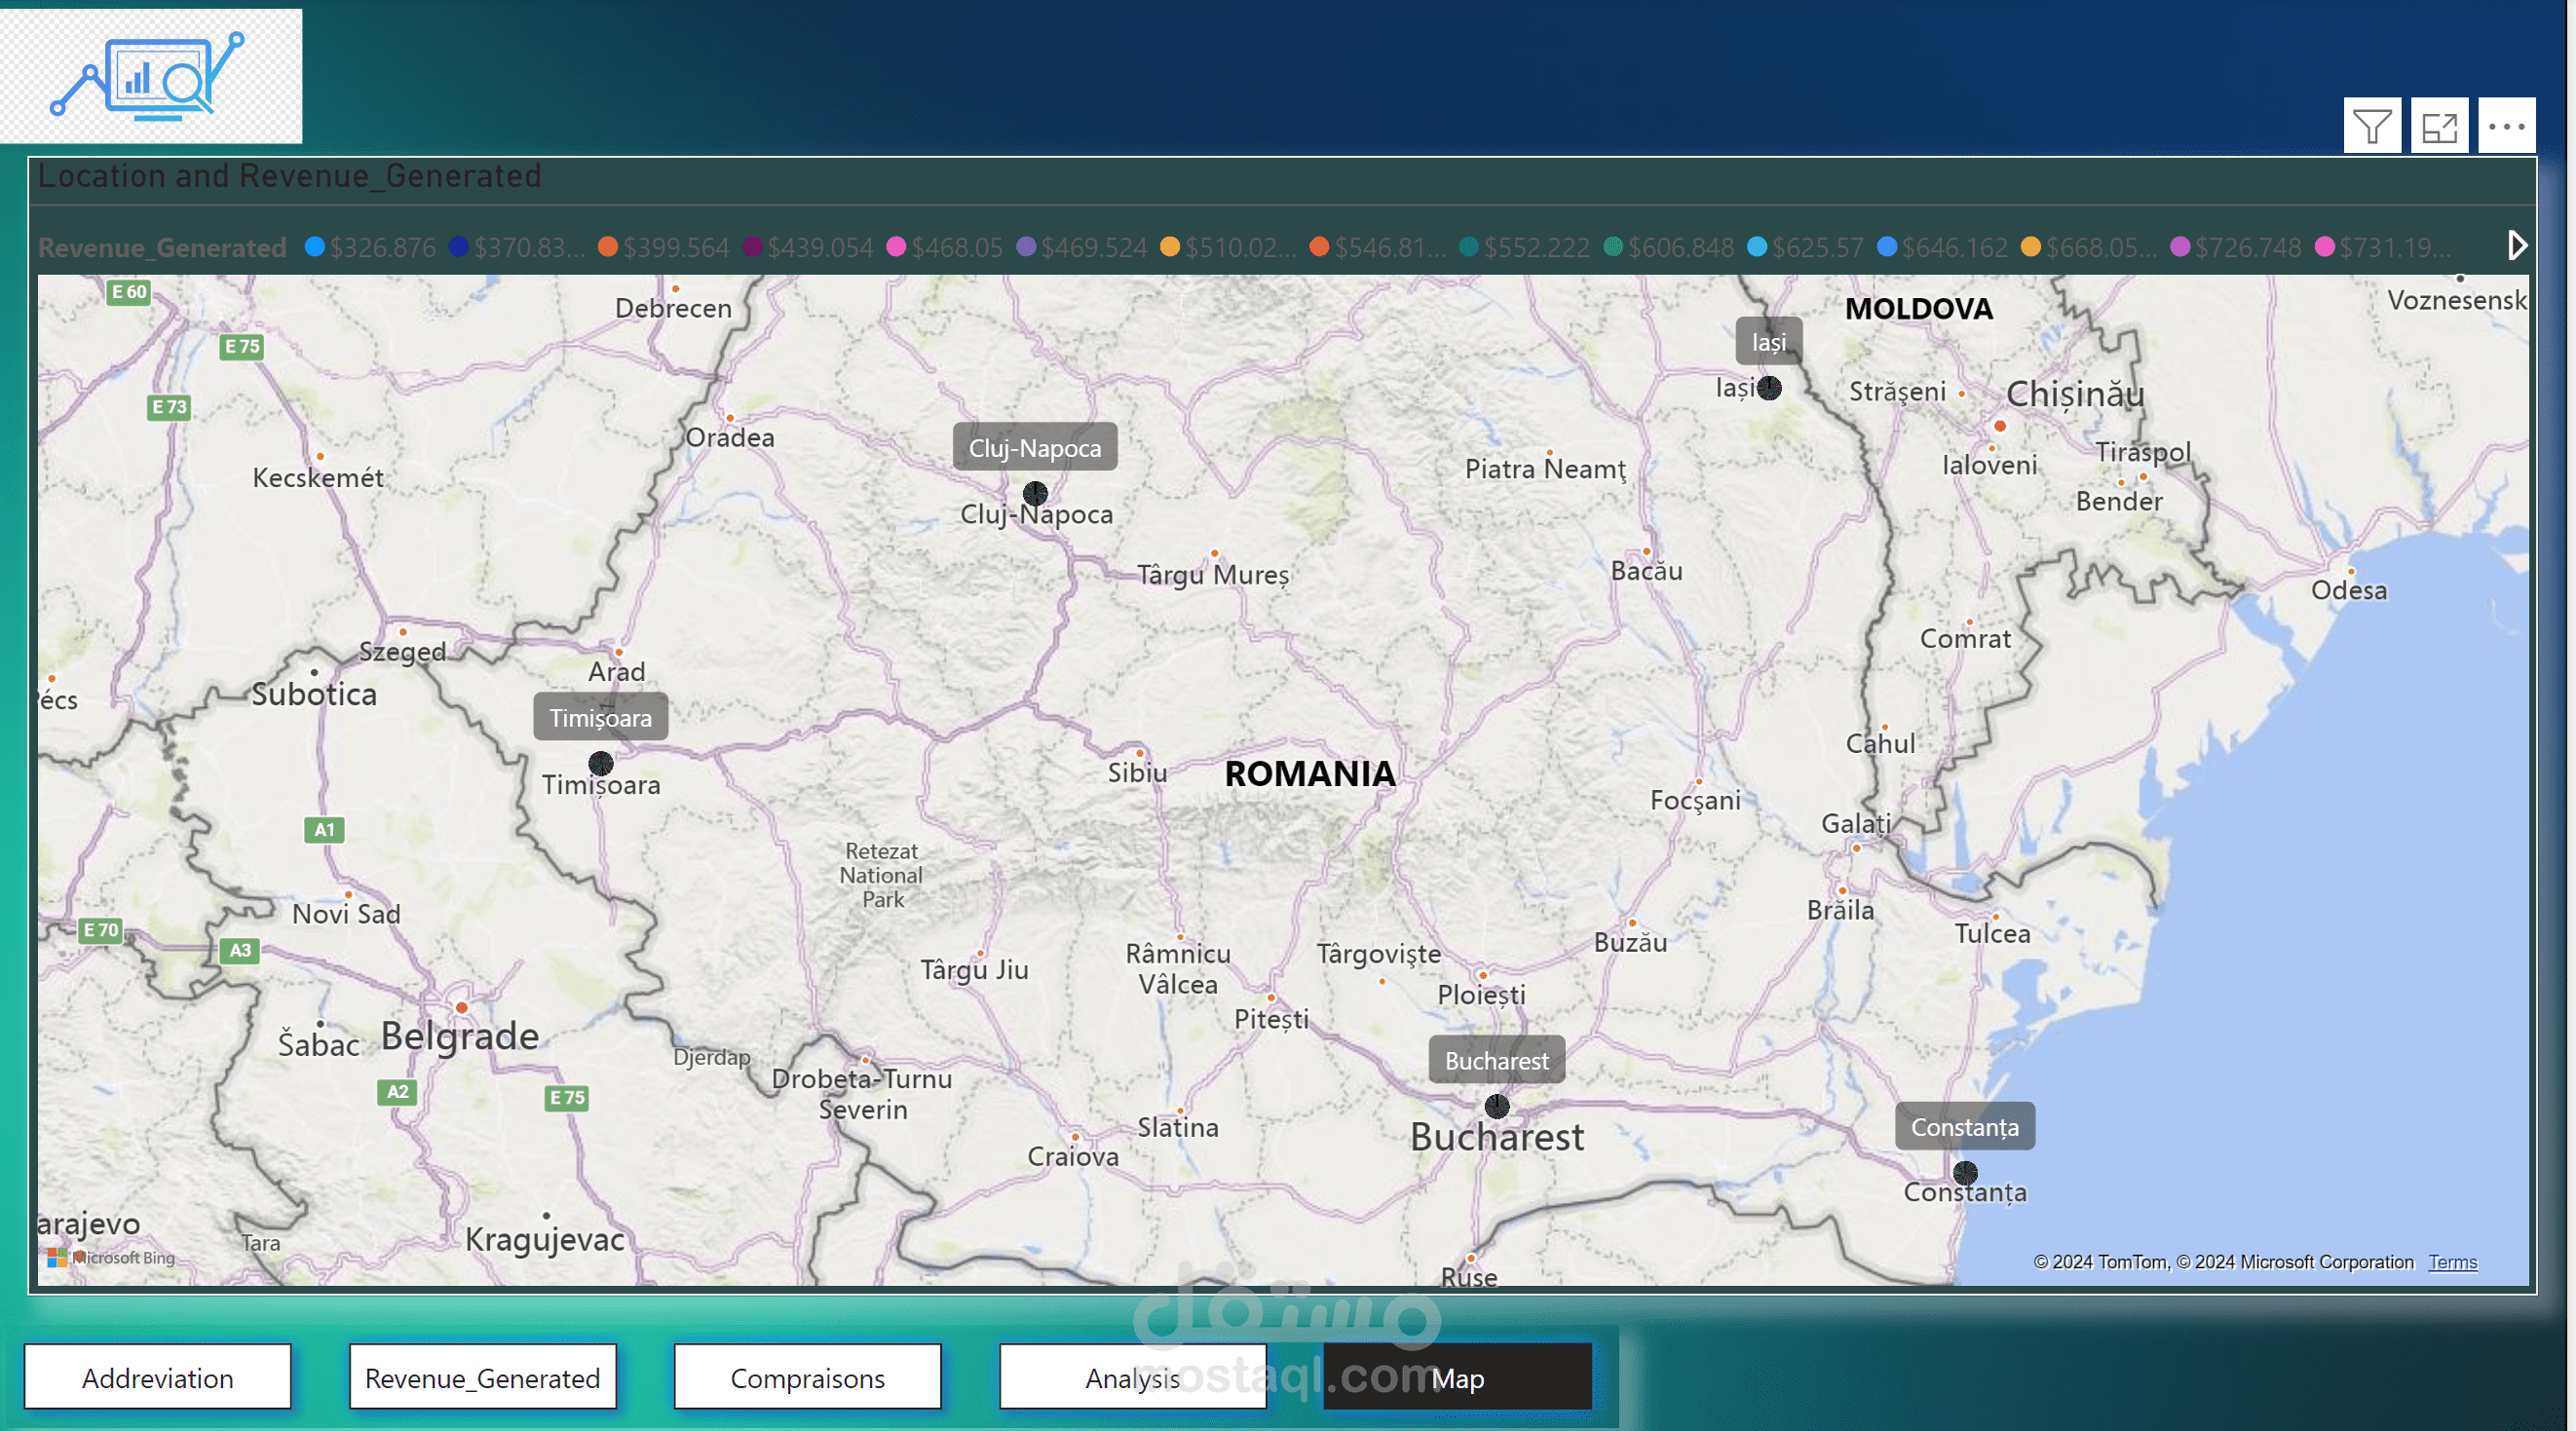
●Demographics Insights: Charts showing the breakdown of conversions and revenue by age, gender, and location.
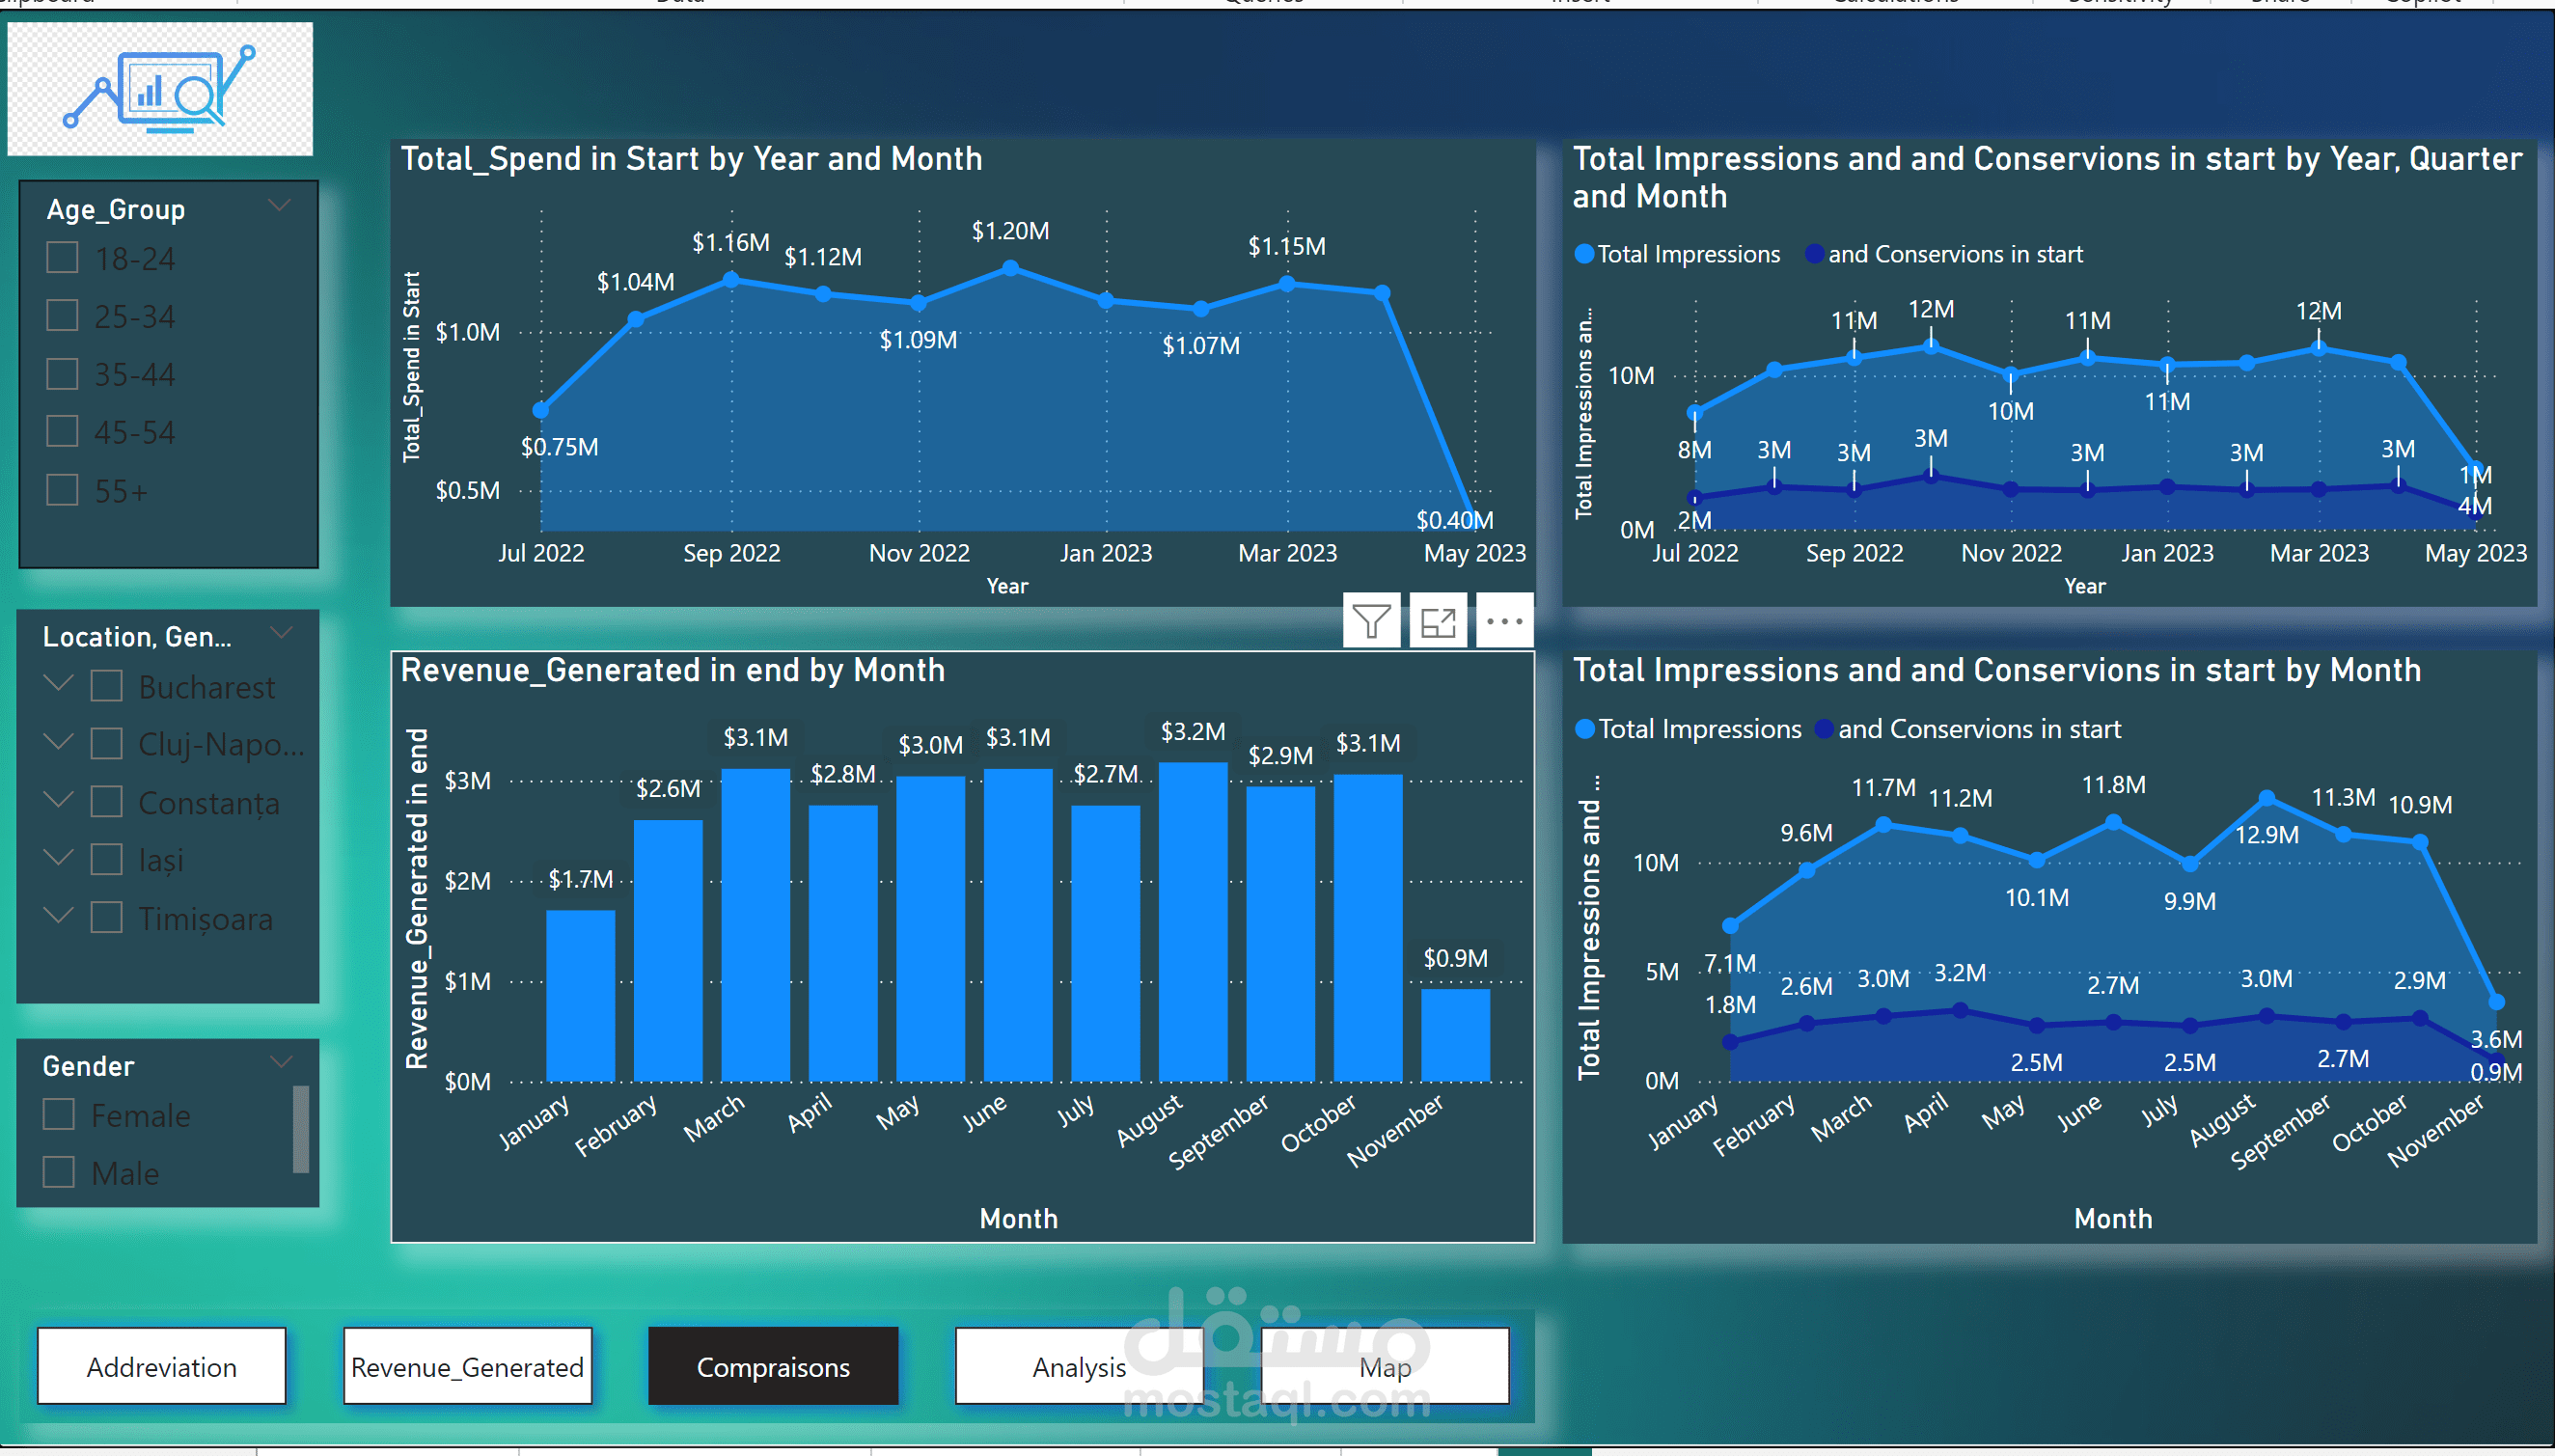
●Trend Analysis: Line or area chart showing campaign metrics over time (impressions, clicks, conversions).
________________________________________