Egypt Real Estate Market Overview
تفاصيل العمل
Our project provides a detailed analysis of the real estate market, focusing on price and unit analysis across various regions using Excel, Power Query, Power BI, and DAX.
We used Excel for initial data validation, adding regional information to enhance the dataset. In Power Query, we cleaned the data by merging queries, replacing missing or incorrect values, fixing typos, and adding custom columns. We also converted data types for consistency.
1. Menu
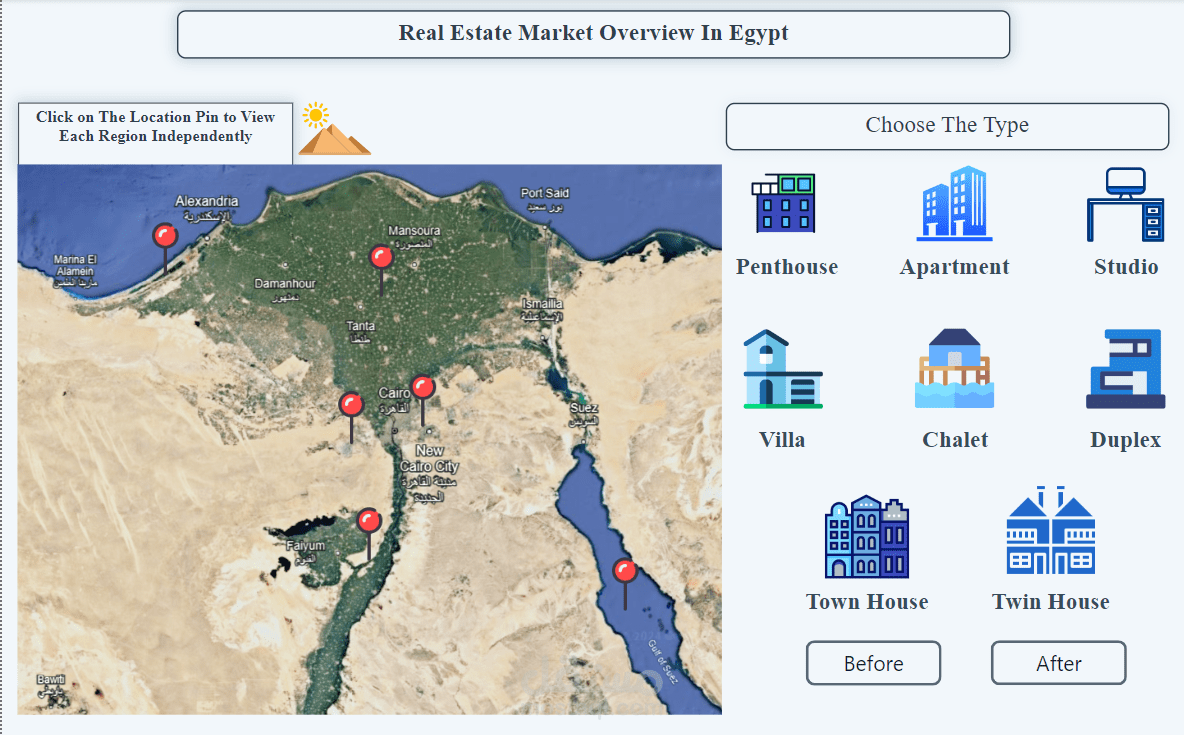
An interactive*menu created with Power BI bookmarks allows users to navigate dashboards based on analysis type or region. The menu also features a Before button, enabling users to switch between cleaned and uncleaned data views to see and compare the impact of data preparation.
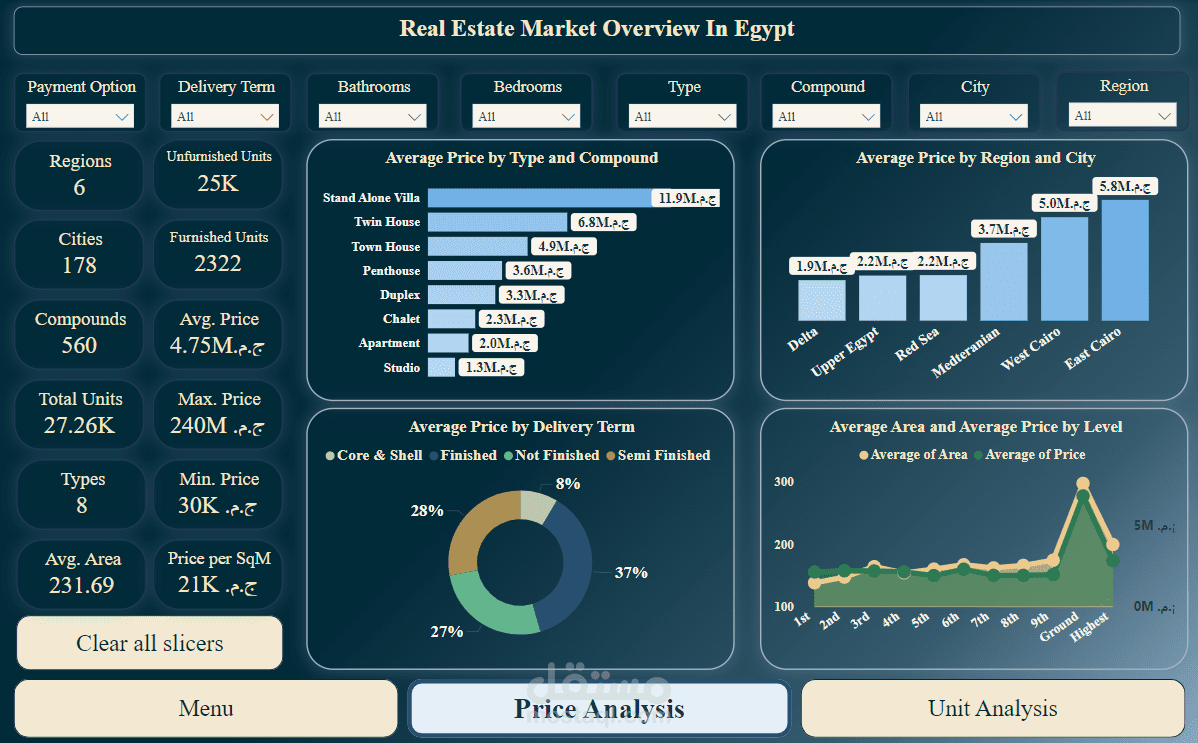
2. Price Analysis
This section examines price trends across regions and property types. Using DAX, we calculated key price metrics like average prices, displayed in cards on the dashboard. This analysis helps reveal regional pricing patterns and strategies.
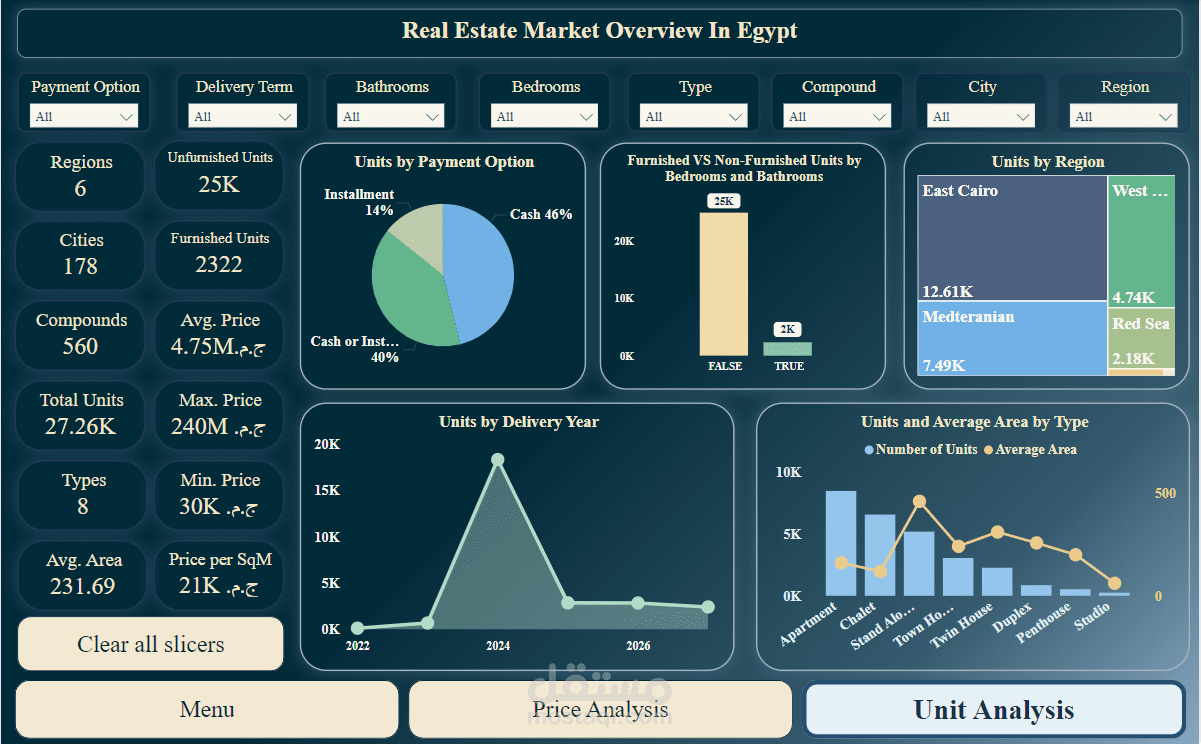
3. Unit Analysis
We analyzed the number of units, segmented by region and property type. DAX measures were also used to calculate other indicators, offering insights into market demand and supply dynamics.
Power BI visualizations and DAX measures helped us present a comprehensive overview of price and unit trends, and other key metrics displayed for quick reference.
ملفات مرفقة
بطاقة العمل
| اسم المستقل | Haneen H. |
| عدد الإعجابات | 0 |
| عدد المشاهدات | 9 |
| تاريخ الإضافة | |
| تاريخ الإنجاز |


