KPI Evaluation
تفاصيل العمل
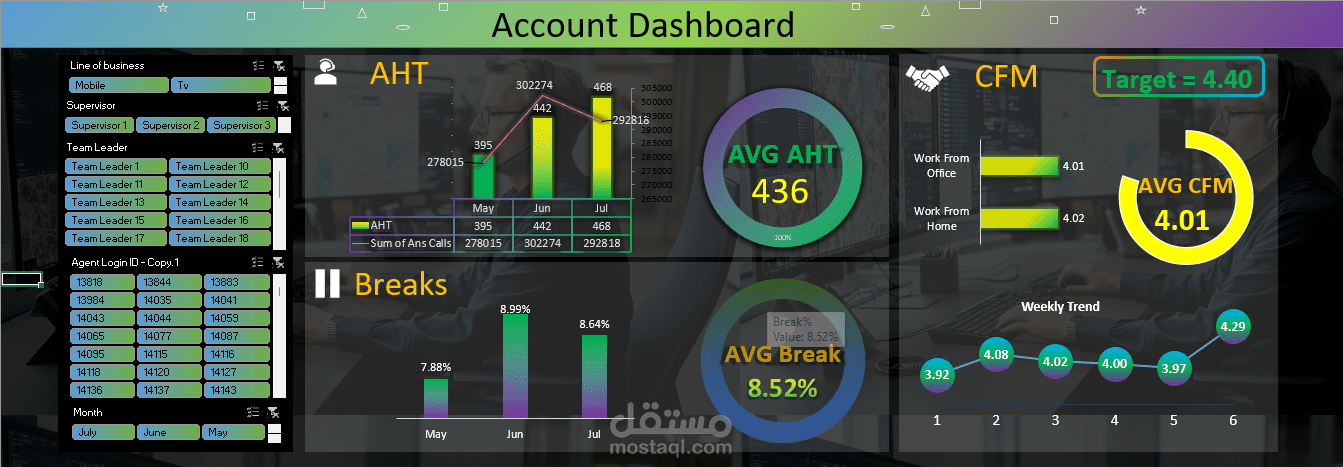
This Project is using (Microsoft Excel , Power Query , Power Pivot , Excel Dashboard) to Visualize KPI (Key Performance Indicator) for many factors such as productivity (Number of calls received and AHT[Average Handling time]) and as well for CSAT (Customer Satisfation) for a communication company supporting its' customers through customer service