Cost of Living Dashboard
تفاصيل العمل
Cost of Living Index (Excl. Rent): This index indicates the relative prices of consumer goods like groceries, restaurants, transportation, and utilities. It excludes accommodation expenses such as rent or mortgage. For instance, a city with a Cost of Living Index of 120 is estimated to be 20% more expensive than New York City (excluding rent).
Rent Index: This index estimates the prices of renting apartments in a city compared to New York City. If the Rent Index is 80, it suggests that the average rental prices in that city are approximately 20% lower than those in New York City.
Cost of Living Plus Rent Index: This index estimates consumer goods prices, including rent, in comparison to New York City.
Groceries Index: This index provides an estimation of grocery prices in a city relative to New York City. Numbeo uses item weights from the "Markets" section to calculate this index for each city.
Restaurants Index: This index compares the prices of meals and drinks in restaurants and bars to those in NYC.
Local Purchasing Power: This index indicates the relative purchasing power in a given city based on the average net salary. A domestic purchasing power of 40 means that residents with an average salary can afford, on average, 60% .
less goods and services .
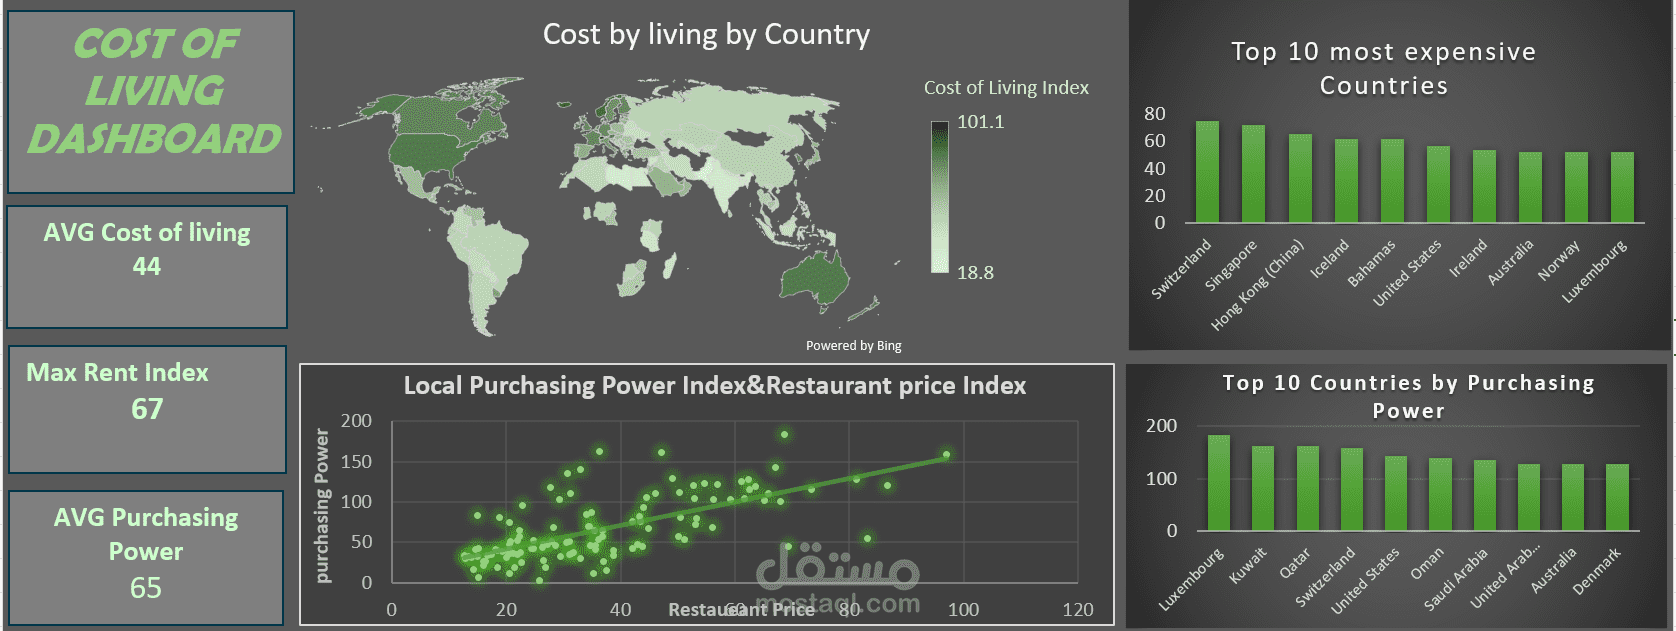
I explored the data and made and some calculations, made pivot tables to summarize data to get insights, made visualizations to get insights from row data, then I designed dashboard to show my findings .
here are my findings
There is a positive relation between Local Purchasing Power Index and
Restaurant Price Index
Australia ,North America and Eastern Europe have the most cost of living
Luxembourg has the most Purchasing Power
Swizerland is the most expensive country
بطاقة العمل
| اسم المستقل | عبدالله ر. |
| عدد الإعجابات | 0 |
| عدد المشاهدات | 9 |
| تاريخ الإضافة |

