Market Sales
تفاصيل العمل
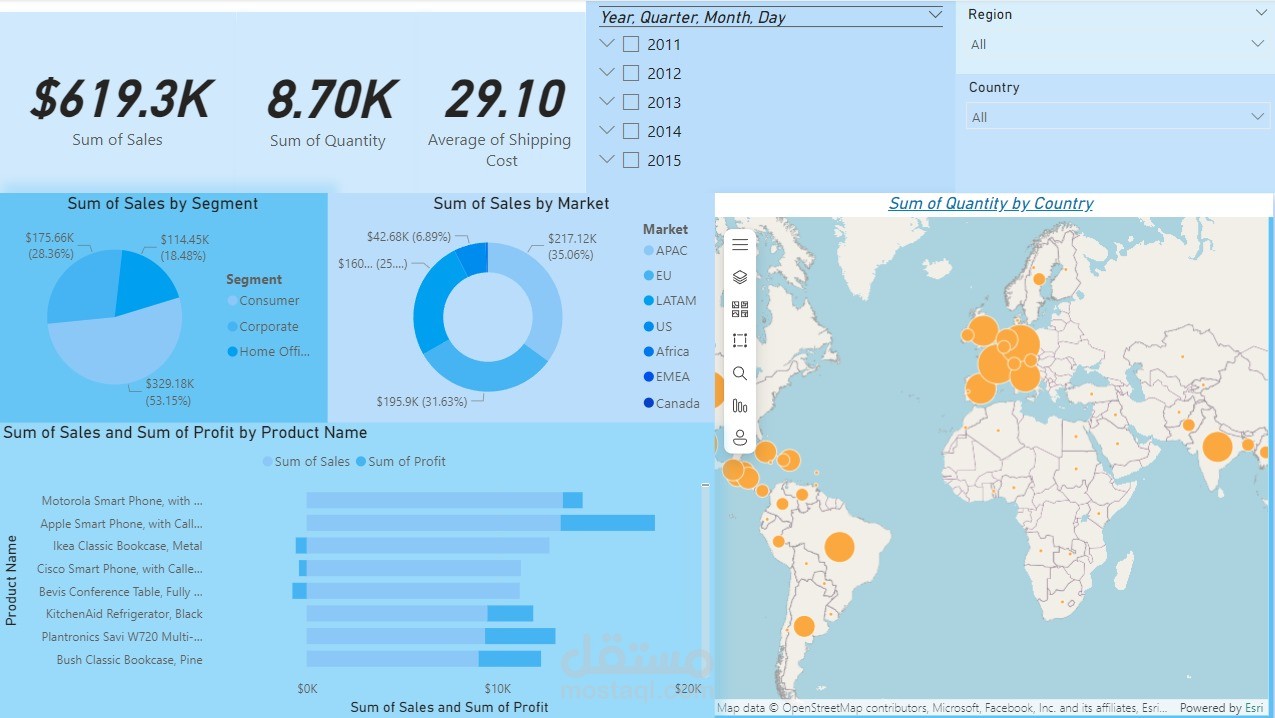
I’m excited to share my latest project on Power BI, where I analyzed Market Sales data to uncover key insights and trends with interactive dashboard.
In this Project, I have Analyze the sales of the company and suggest some growth tips to improve sales growth .
Tools Used in Project
- SQL for analyzing the business problem statement
- Power BI for visualization of business problems
- MS Word for documentation.
Key Insights
●Regional Performance
- North America appears to be the dominant region in terms of both sales and profit.
- Europe also shows significant sales and profit.
- Asia has the lowest sales and profit figures among the displayed regions.
●Market Performance
- APAC market has the highest sales.
- EMEA market has the second-highest sales
- US market has the lowest sales
●Sub-Category Performance
- Phones and Bookcases are the top-selling sub-categories
- Art and Furnishings have the lowest sales
●Additional Observations
- Country-level data is available for further analysis
- Map visualization provides a quick overview of regional distribution.
- Bar charts offer detailed comparisons of sales and profit across markets and sub-categories
●Recommendations
- Expand Data: Incorporate historical data to identify long-term trends and seasonality patterns
- Enhance Visualization: Consider adding interactive features to the dashboard to enable deeper analysis
- Conduct Regular Reviews: Schedule periodic reviews of the dashboard to monitor performance and identify areas for improvement
ملفات مرفقة
بطاقة العمل
| اسم المستقل | Mohammed K. |
| عدد الإعجابات | 0 |
| عدد المشاهدات | 13 |
| تاريخ الإضافة |
