Car Sales Dashboard Analysis (2019-2022)
تفاصيل العمل
Car Sales Dashboard Analysis (2019-2022)
Car Sales Dashboard Analysis (2019-2022)
Project Overview:
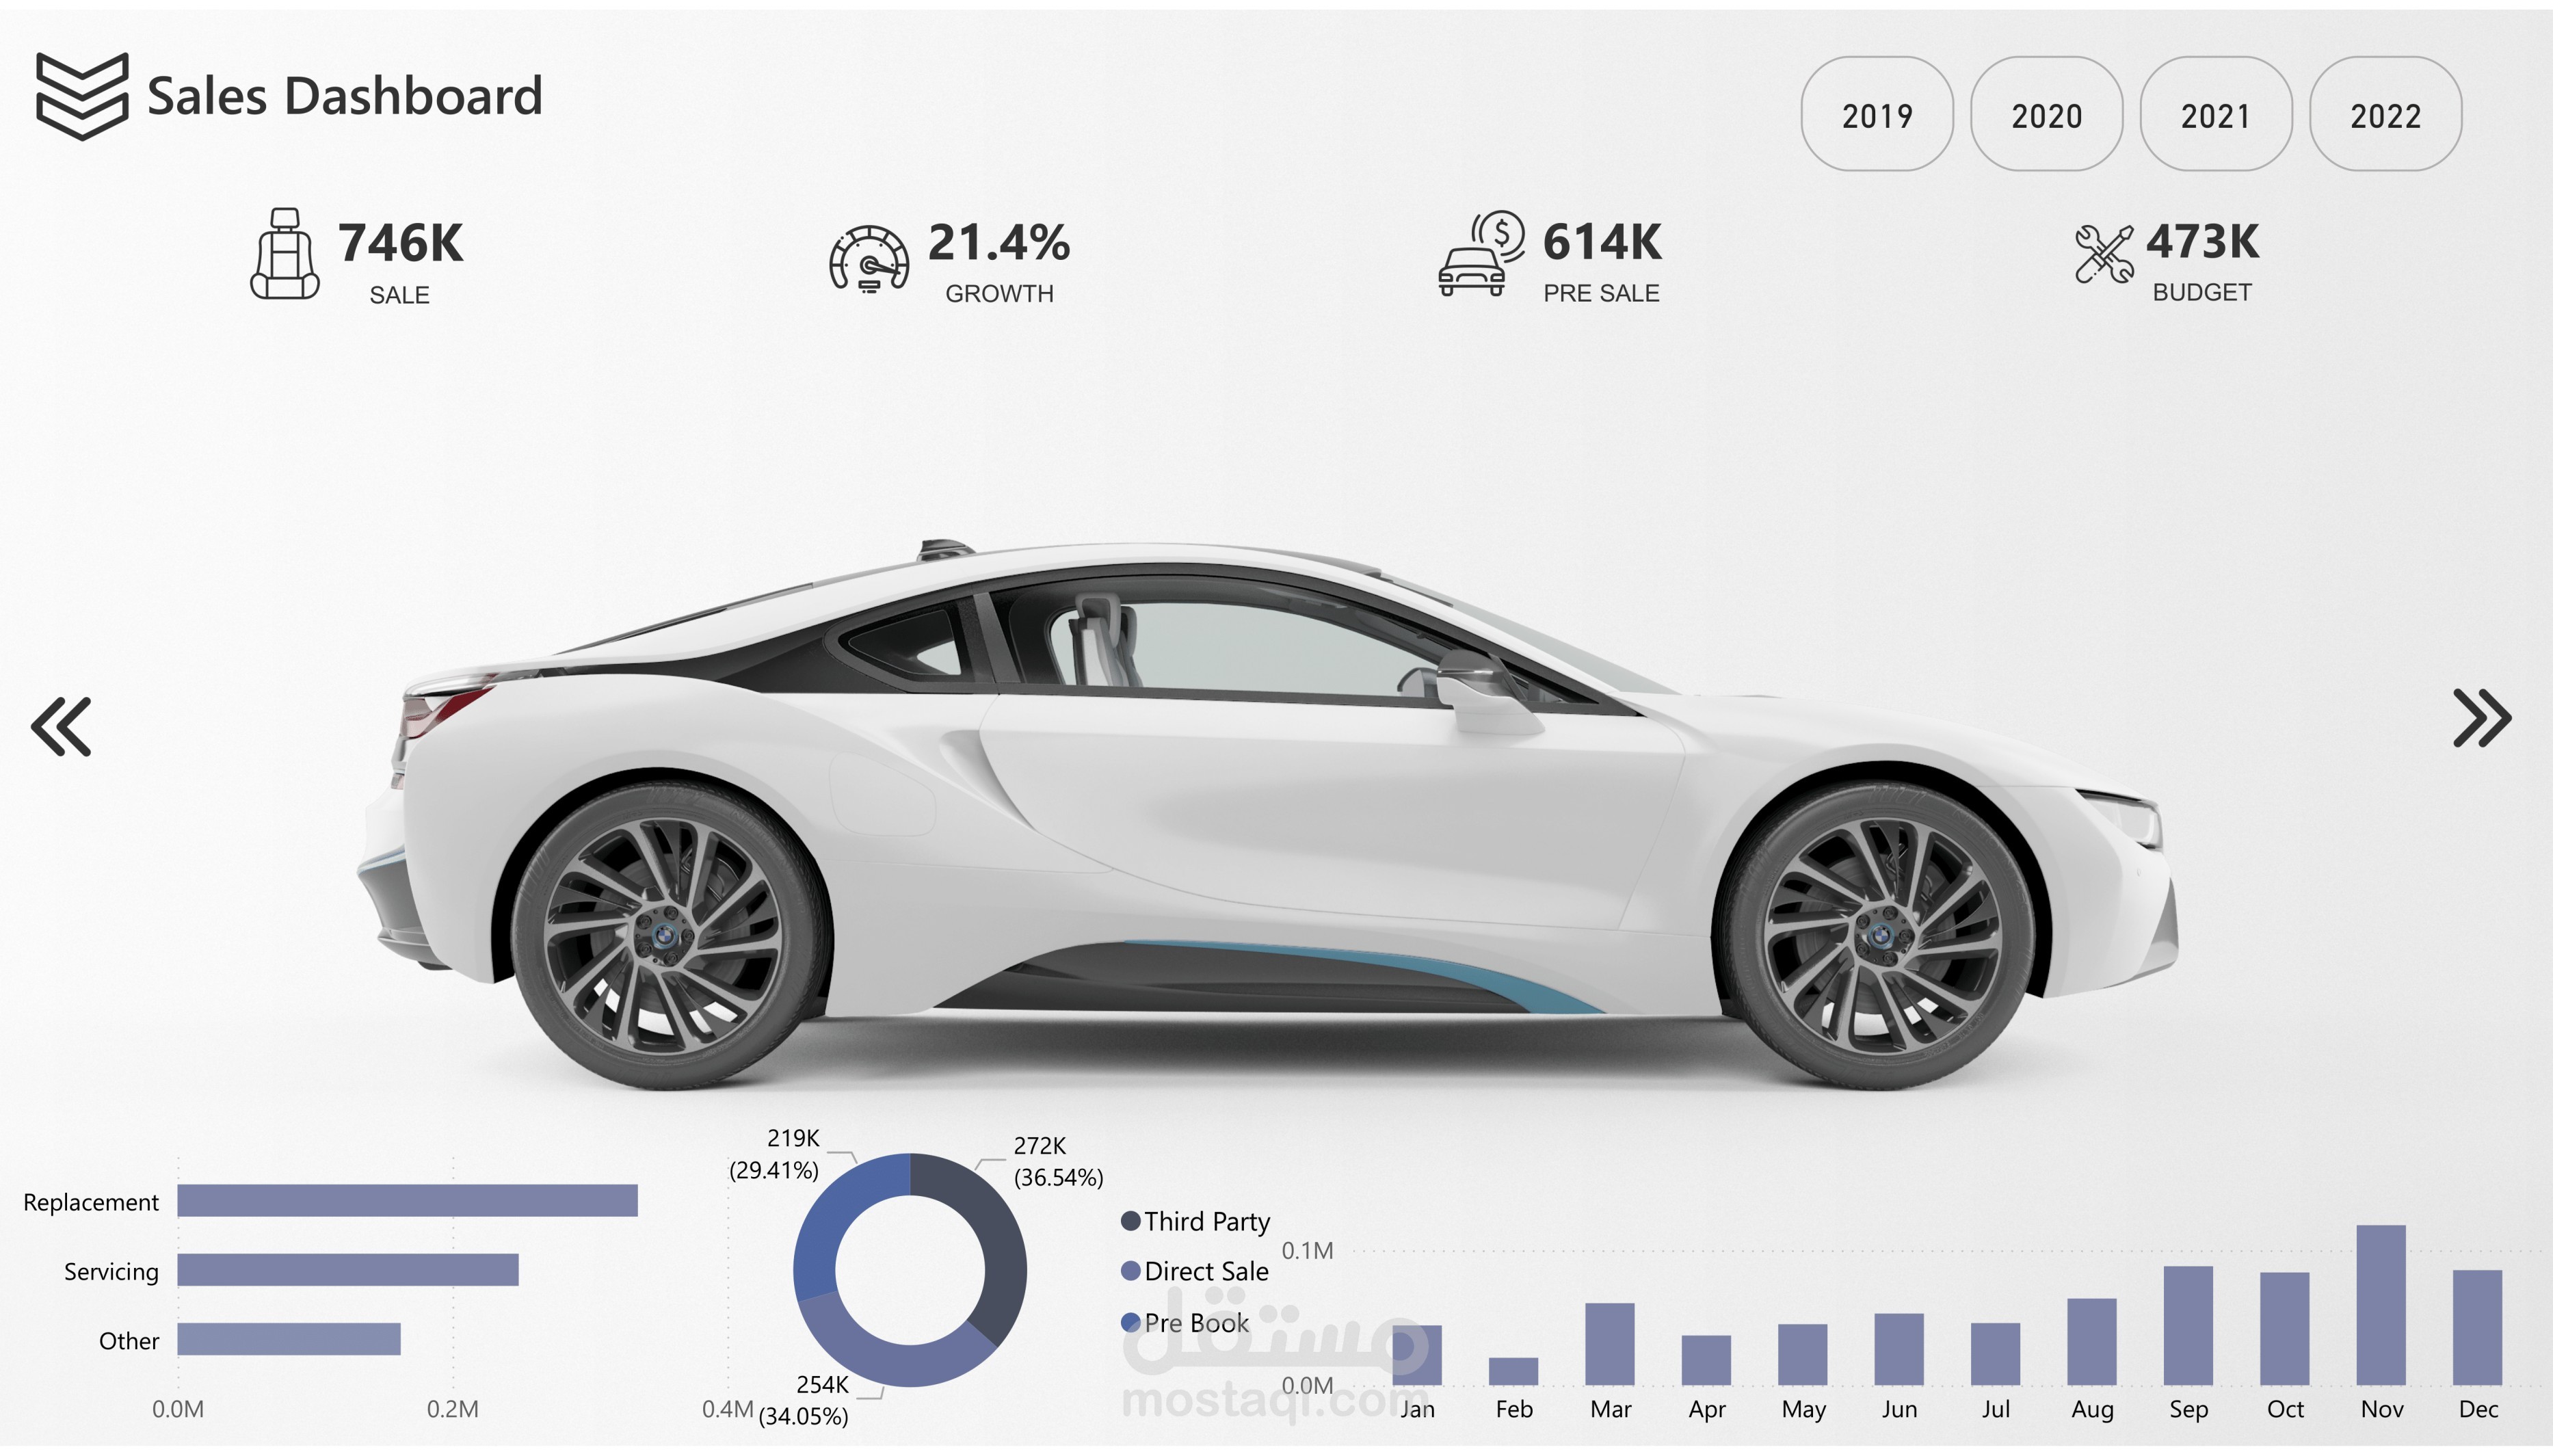
I developed a comprehensive Car Sales Dashboard using Power BI, designed to provide key insights into car sales performance over a 4-year period (2019-2022). This dashboard helps stakeholders understand trends, optimize sales strategies, and make data-driven decisions.
Key Features:
Sales Growth Tracking: Visualized a 21.4% year-over-year (YoY) sales growth, highlighting sales performance by category (Third Party, Direct Sale, Pre-Book).
Revenue vs Budget: Analyzed sales against budget targets, helping the team track financial goals with real-time updates.
Category Breakdown: Detailed breakdown of car sales by service types (Replacement, Servicing, Other) to identify growth areas and customer needs.
Time-Series Analysis: Monthly sales performance trends to identify peak sales periods and anticipate market demands.
Tools Used:
Power BI: For interactive data visualization and performance tracking.
Power Query: To clean and transform raw sales data from multiple sources.
Excel: For initial data structuring and budget analysis.
Impact:
The dashboard became a critical tool for sales teams and decision-makers, enabling them to pinpoint opportunities for growth, streamline sales processes, and drive more targeted marketing efforts.
