Central Superstore - Dashboard
تفاصيل العمل
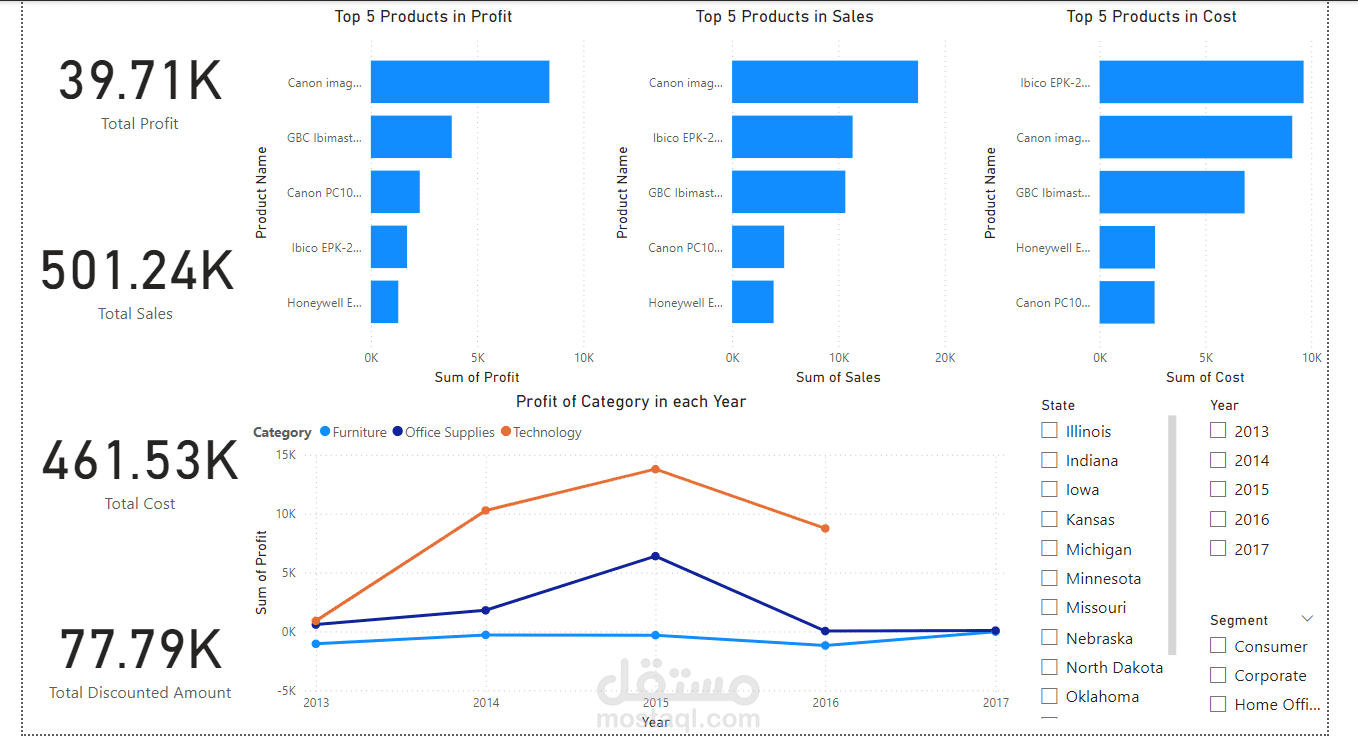
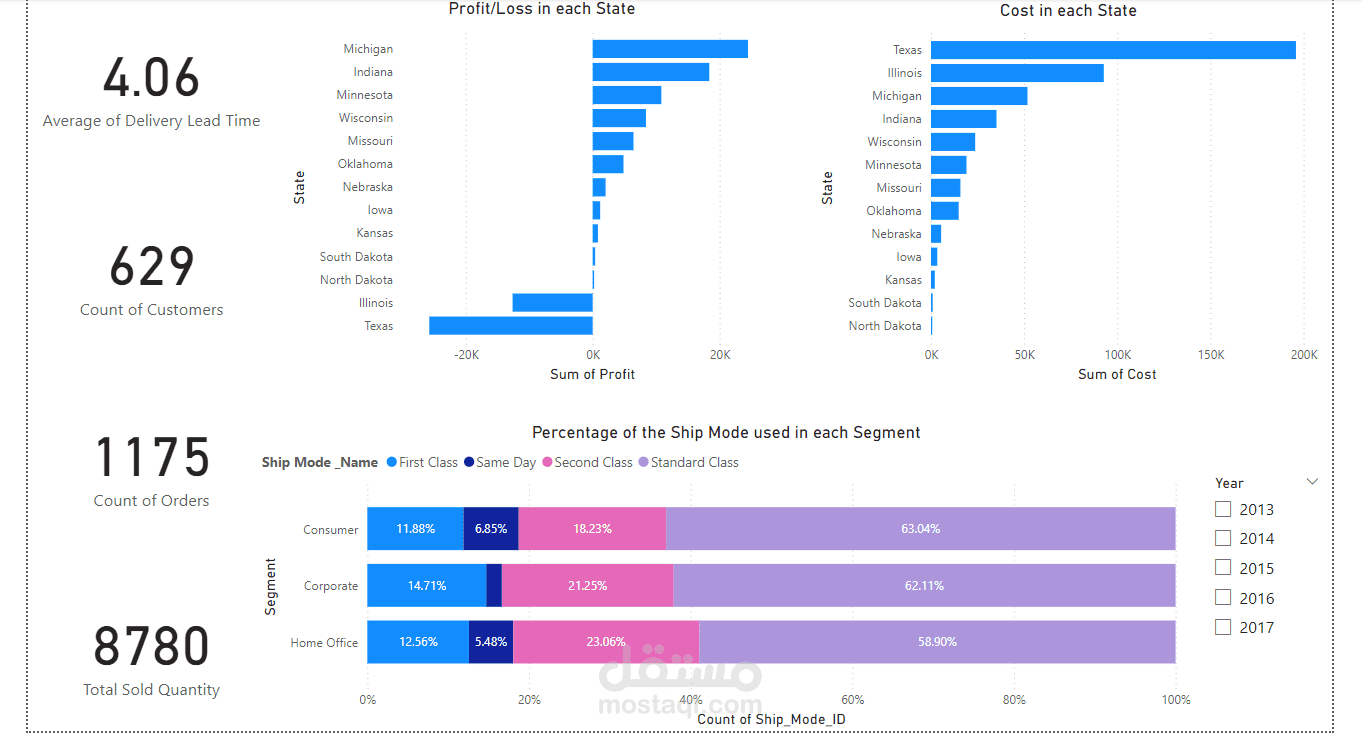
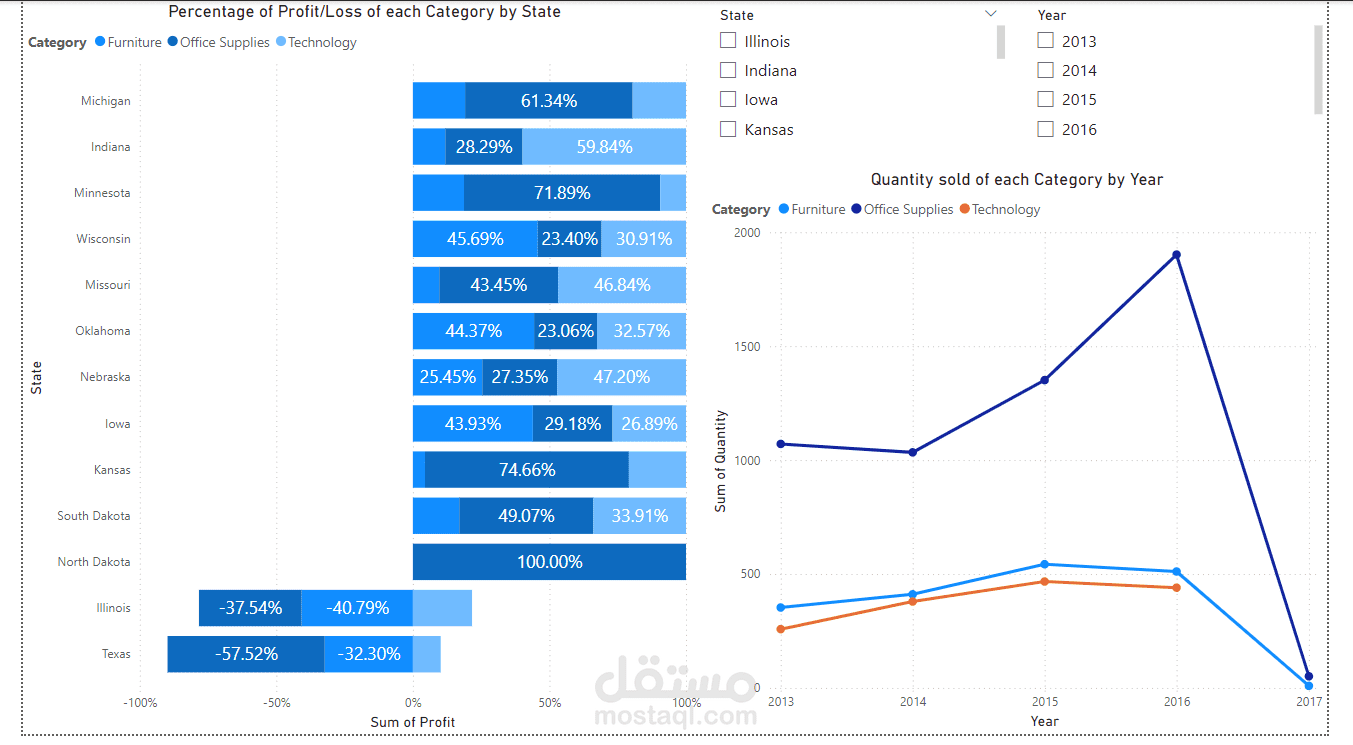
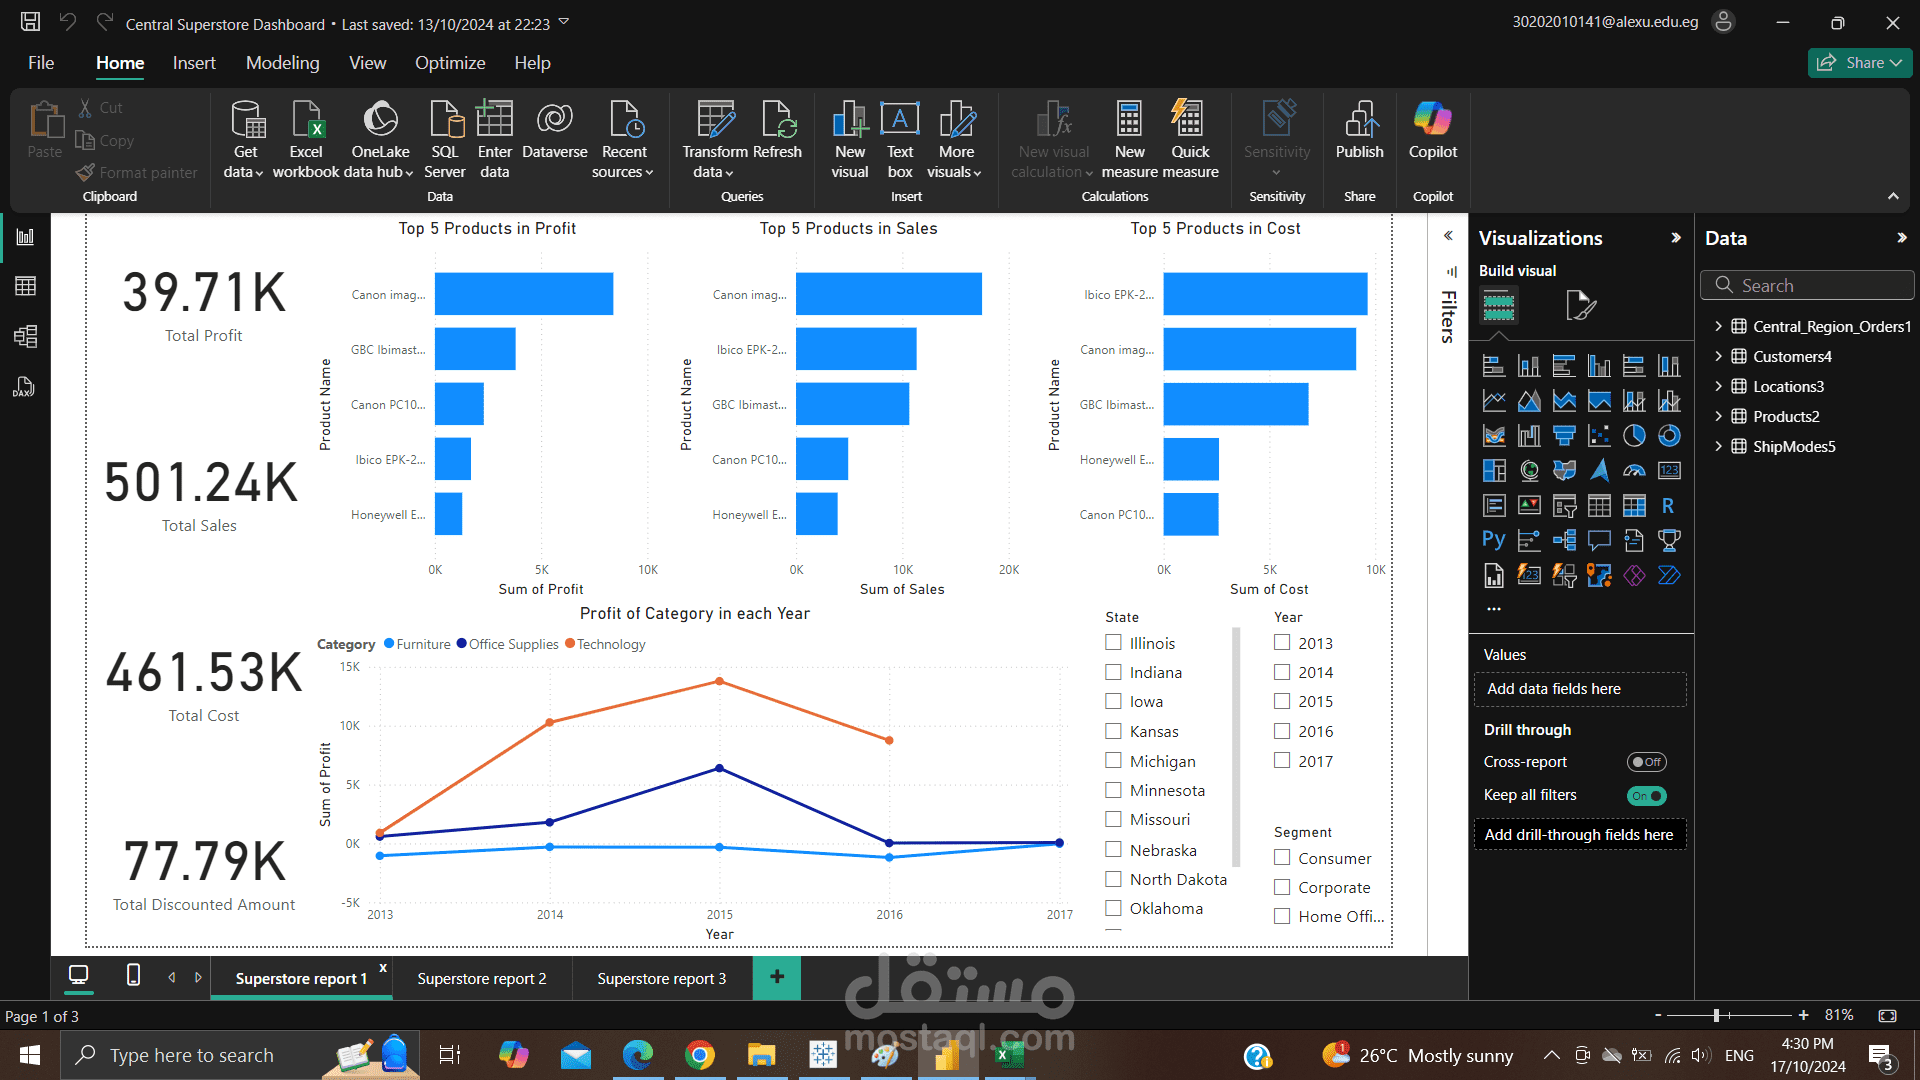
In this project, I utilised Power BI to develop an interactive dashboard for analysing sales and performance data for the Central Superstore. The dashboard provides key insights into sales trends, product performance, customer demographics, and regional performance. By creating visualizations such as bar charts, line graphs, and pie charts, I enabled stakeholders to easily track performance metrics, identify top-performing products, and make data-driven decisions to improve business strategies.
ملفات مرفقة
بطاقة العمل
| اسم المستقل | Hania S. |
| عدد الإعجابات | 0 |
| عدد المشاهدات | 6 |
| تاريخ الإضافة | |
| تاريخ الإنجاز |


