https://archive.ics.uci.edu
تفاصيل العمل
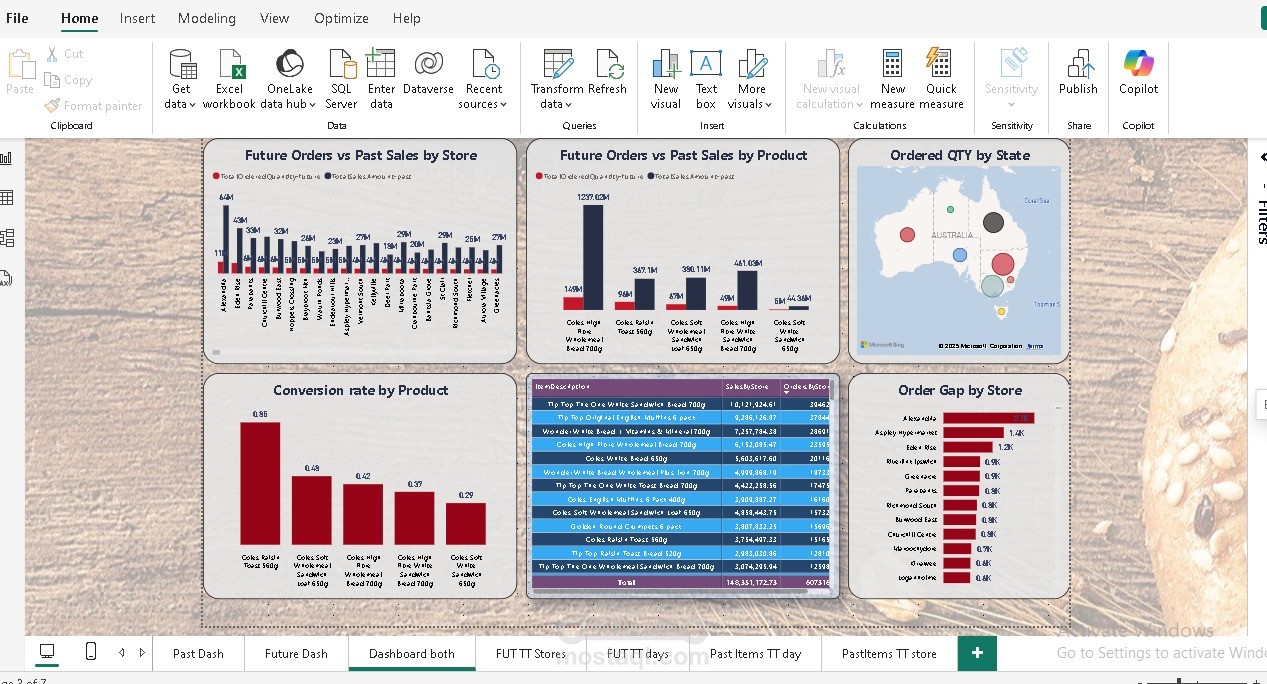
Project Overview
This project focuses on analyzing sales data for a bakery to uncover insights that can drive business decisions. The data includes both past orders and planned future orders, providing a comprehensive view of sales trends, top-performing products, and operational efficiency.
Key Objectives
Understand Sales Trends: Analyze daily and monthly sales trends to identify peak periods and seasonal variations.
Identify Top Performers: Determine the top-selling items, states, and stores to focus on high-performing areas.
Evaluate Operational Efficiency: Assess lead times for preparing future orders and the consistency of sales across stores.
Plan for Future Orders: Analyze planned future orders to ensure adequate preparation and resource allocation.
Data Sources
Past Orders: Historical data on items sold, quantities, and sales values.
Planned Future Orders: Data on upcoming orders, including delivery dates and quantities.
Tools and Technologies Used
Power BI: For data visualization and creating interactive dashboards.
Power Query: For data cleaning, transformation, and preprocessing.
Excel: For initial data storage and basic analysis.
Data Cleaning and Preprocessing
Data Upload and Extraction: Data was uploaded and extracted from Excel sheets.
Transformation: Using Power Query Editor, the data was transformed by changing data types, formatting dates, adding conditional columns, and handling null values.
Merging Data: Past and future orders were merged to create a unified dataset for analysis.
Analysis and Insights
Total Sales Analysis:
Calculated the total value and quantities sold in the past.
Identified the total quantities planned to be sold in the future.
Top Performers:
Identified the top-selling items, states, and stores.
Highlighted the most consistent stores in terms of sales performance.
Sales Trends:
Analyzed daily and monthly trends to understand sales patterns.
Identified peak sales periods and potential areas for improvement.
Operational Insights:
Evaluated the number of orders by service type (e.g., delivery, in-store).
Assessed lead times for preparing future orders to ensure timely delivery.
Visualization and Storytelling
Interactive Dashboards: Created in Power BI to visualize key metrics and trends.
Data Storytelling: Presented insights in a way that drives decision-making, focusing on actionable recommendations for the bakery.
Outcome
Provided actionable insights to optimize sales strategies, improve operational efficiency, and plan for future orders.
Enabled the bakery to focus on high-performing products and stores while addressing areas with lower sales.
Skills Demonstrated
Data Cleaning and Preprocessing: Proficient in using Power Query for data transformation.
Data Analysis: Strong analytical skills to uncover trends and insights.
Data Visualization: Expertise in creating interactive dashboards using Power BI.
Business Acumen: Ability to translate data insights into actionable business strategies.
How to Add to Your Portfolio
Title: Bakery Sales Analysis Project
Description: Summarize the project objectives, tools used, and key outcomes.
Skills Highlighted: Mention the technical skills (Power BI, Power Query, Excel) and soft skills (data storytelling, business analysis).
Visuals: Include screenshots of the Power BI dashboards or key visualizations.
Impact: Emphasize how the analysis helped the bakery improve its operations and sales strategies.