sales-dashboard-2012-2014
تفاصيل العمل
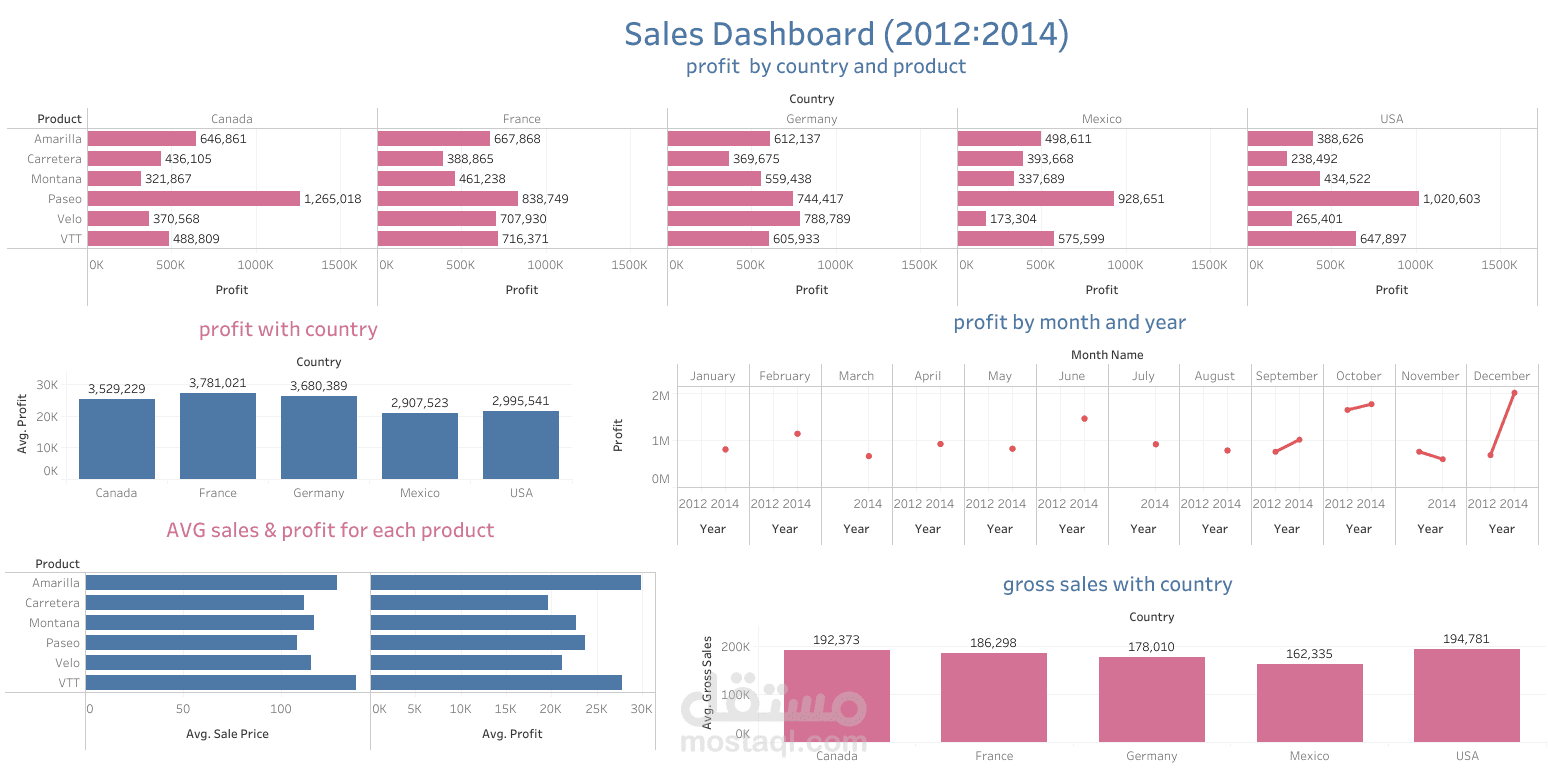
لوحة تحكم تفاعلية لتحليل المبيعات (2012–2014)
قمت بتصميم لوحة معلومات لعرض مؤشرات الأداء والربحية عبر 5 دول و6 منتجات. تشمل اللوحة:
تحليل الأرباح حسب الدولة والمنتج.
عرض اتجاهات المبيعات والأرباح الشهرية والسنوية.
مقارنة أداء الأسواق المختلفة واكتشاف المنتجات الأعلى ربحًا.
ما يميز هذا العمل: تقدم اللوحة نظرة شاملة ومقارنة لأداء المبيعات عالميًا، مما يساعد أصحاب القرار على تحديد الأسواق الأكثر ربحًا، وفهم التأثير الموسمي، واتخاذ قرارات استراتيجية مدروسة بفضل العرض البصري الواضح والمنظم.

