Amazon Sales
تفاصيل العمل
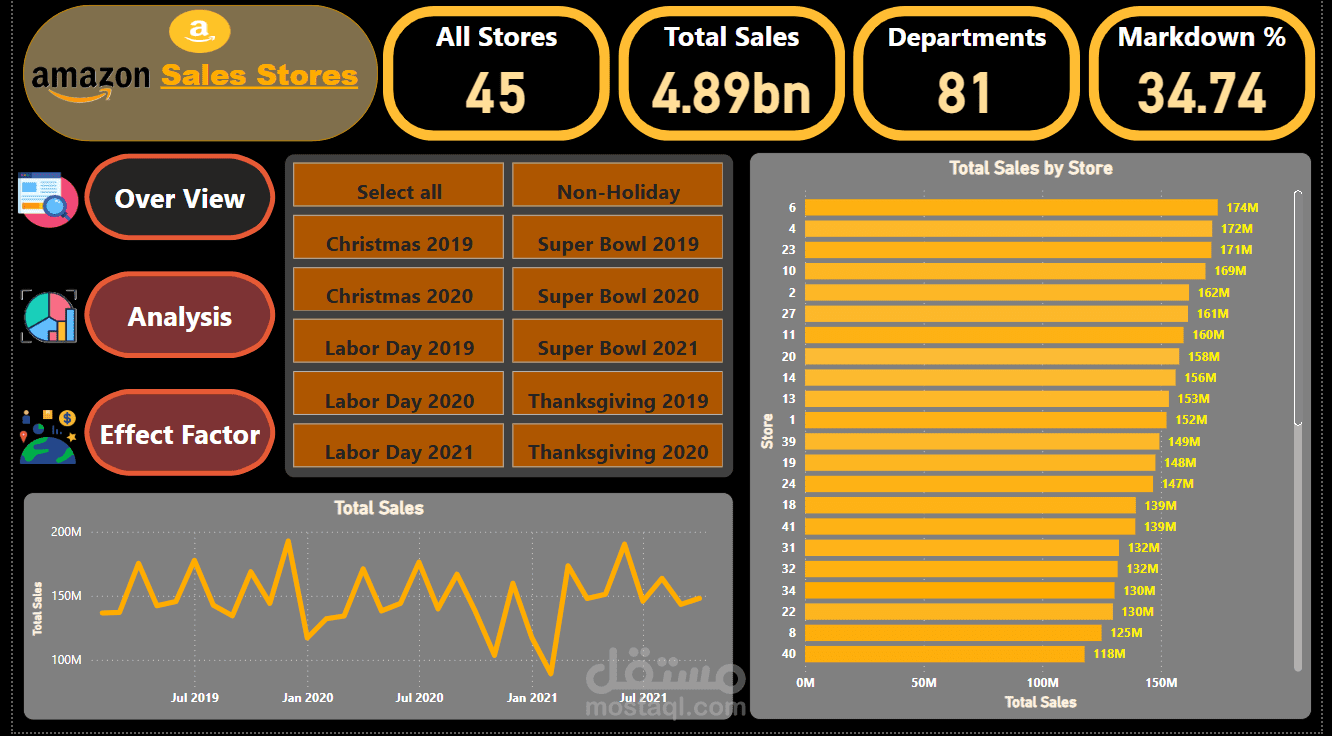
1. Overview Page
This page provides a high-level summary of key metrics and allows users to quickly
assess Amazon's overall store performance. It is designed to give a quick snapshot of
Total Stores and Departments, sales performance, markdown percentages, with
interactive filtering options by holiday types and years.
1. Key Metrics Summary (Top Pane):
o All Stores: Displays the total number of stores (45).
o Total Sales: Shows the cumulative sales across all stores (4.89 billion).
o Departments: Shows the number of unique departments (81).
o Markdown Percentage: Displays the overall markdown percentage across
all stores (34.74%).
2. Interactive Filters (Left Pane):
o Holiday Type: Filter sales data by selecting specific holidays (e.g.,
Christmas, Labor Day, Super Bowl) or "Non-Holiday".
o Years: Allows users to toggle between different years for holiday-based
comparisons (e.g., Christmas 2019, Christmas 2020).
`
o Select All/None: Buttons to toggle between all holidays or no holiday
filters.
3. Visualizations (Center and Right Pane):
2. Total Sales by Store (Bar Chart):
o Description: Displays the sales totals for each store.
o Insights:
Top store sales reach up to 174 million.
Store 6, 23, and 10 are among the highest revenue generators, with
store 6 leading at 174M.
3. Total Sales Over Time (Line Chart):
o Description: Displays the trends of total sales over time.
o Insights:
Significant spikes in sales occur around major holidays such as
Labor Day and Christmas.
There is noticeable seasonality with peaks around July and
December.
Interactive Features:
Button to open other dashboards:
o Buttons on the top-right allow users to open other parts of the
dashboards.
Purpose and Usage:
This dashboard serves as a comprehensive tool for stakeholders to monitor
store sales performance and markdown percentages. It is designed for the
marketing, management, and customer relations teams, providing insights into
sales trends, holiday impacts, and store-wise performance. The interactive filters
enable quick exploration and comparison of data across different stores, and
holidays
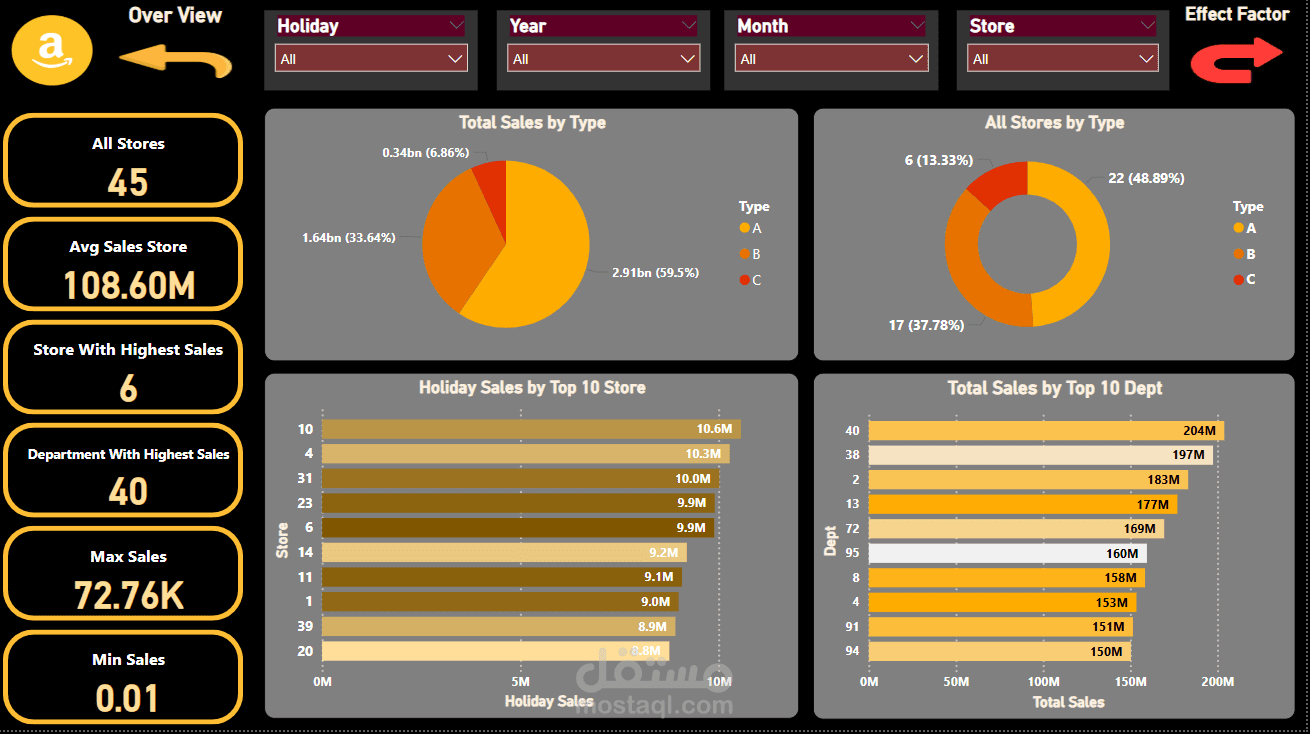
2. Analysis Page
This page provides a high-level summary of key performance metrics for Amazon's
store sales. It is designed to allow users to assess the sales performance across
different stores, departments, and the effect of Holidays, and type while also filtering
data by holiday types, years, Month, and store specifics.
Key Metrics Summary (Left Pane):
o All Stores: Displays the total number of stores, which is 45.
o Avg Sales Per Store: Average sales across all stores are 108.60 million.
o Store With Highest Sales: The store with the highest sales is store 6.
o Department With Highest Sales: Department 40 has the highest sales.
o Max Sales: The maximum individual sales figure is 72.76K.
o Min Sales: The minimum sales figure is 0.01.Interactive Filters (Left
Pane):
2. Interactive Filters (Top Pane):
Users can filter data across the following categories:
o Holiday Type: Filter the data based on specific holidays or select all
holidays.
o Year: Users can toggle between different years to compare holiday
sales over time.
o Month: Filters based on specific months.
`
o Store: Allows the user to filter data by a specific store.
3. Visualizations (Center and Right Pane):
Total Sales by Type (Center Left Pie Chart):
This visualization shows the breakdown of total sales by three types, A, B,
and C.
o Type A accounts for 1.64 billion sales (33.64%).
o Type B accounts for 0.34 billion sales (6.86%).
o Type C dominates with 2.91 billion sales (59.5%).
All Stores by Type (Center Right Pie Chart):
This chart displays the total number of stores categorized by type:
o Type A: 6 stores (13.33%).
o Type B: 17 stores (37.78%).
o Type C: 22 stores (48.89%).
Holiday Sales by Top 10 Stores (Bottom Left Bar Chart):
A bar chart that showcases holiday sales for the top 10 performing stores.
o Top insights:
Store 10 leads with 10.6 million in sales.
Store 4 and Store 31 also perform well with 10.3 million and
10 million, respectively.
Total Sales by Top 10 Departments (Bottom Right Bar Chart):
This bar chart visualizes total sales performance across the top 10
departments.
o Key Insights:
Department 40 tops the list with 204 million in sales.
Departments 38 and 12 follow closely with 197 million and
183 million, respectively.
Interactive Features:
Effect Factor: This element (a red arrow on the right and a yellow one on the left)
is used to easily go to other parts of the dashboards.
Purpose and Usage:
This page is essential for understanding key performance metrics across various
sales dimensions. It provides a breakdown by store type, departments, and
holidays, with strong insights into which stores and departments generate the
most revenue. The interactive filters and visual breakdown allow for in-depth
analysis and targeted data exploration.
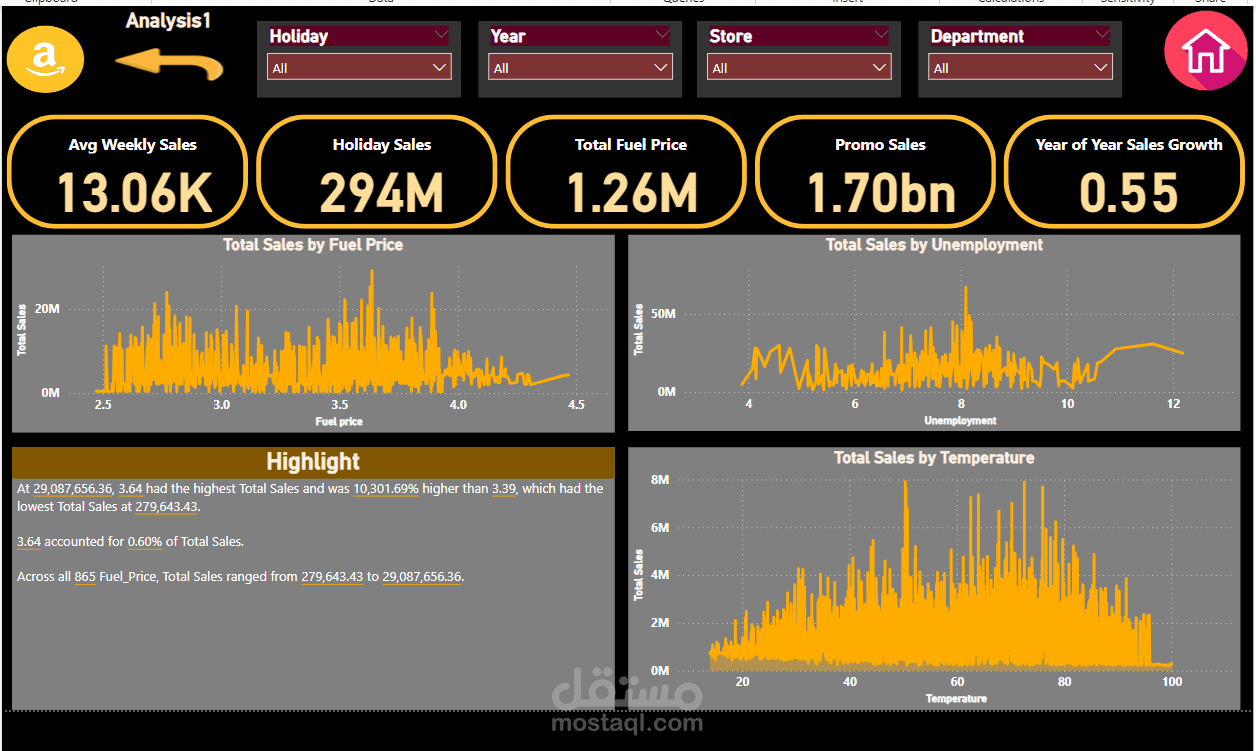
3. Effect Factors Page
This page provides a comprehensive summary of Amazon's store sales performance
metrics. It allows users to analyze various factors affecting sales, including holidays,
departments, and external factors such as fuel prices, unemployment, and CPI. The
page is designed with interactive filters for dynamic data analysis across stores,
departments, years, and holidays.
Key Metrics Summary (Left Pane):
o Average Weekly Sales: 13.06K – The average weekly sales value across all
stores.
o Holiday Sales: 294M – Total sales generated during holiday seasons.
o Average CPI: 173.42 – The average Consumer Price Index.
o Promotional Sales: 1.70bn – Total sales from promotions (markdown).
o Year-over-Year Sales Growth: 0.55 – Growth in sales compared to the
previous year.
2. Interactive Filters (Top Pane):
Users can filter data across the following categories:
o Holiday: Filter the data based on specific holidays or select all
holidays.
o Year: Users can toggle between different years to compare sales
over time.
o Store: Allows the user to filter data by a specific store.
o Department: Allows the user to filter data by a specific Department.
3. Visualizations (Center and Right Pane):
Total Effect of Fuel Prices on Sales (Top Left):
o This line graph shows the relationship between total sales and the
average fuel price over time.
o Key Insight: Higher fuel prices appear to correlate with a slight drop in
sales during certain periods.
Effect of Unemployment on Sales (Top Right):
o This chart tracks the impact of unemployment rates on sales.
`
o Key Insight: As unemployment decreased between 2019 and 2021,
sales maintained a steady rise, indicating resilience in the sales figures
despite economic factors.
Effect of CPI on Sales (Bottom Left):
o Shows how changes in the Consumer Price Index (CPI) affected total
sales.
o Key Insight: CPI fluctuations seem to coincide with periods of varied
sales performance, especially during 2020 and 2021 (HIGH CPI Low
Sales).
Effect of Temperature on Sales (Bottom Right):
o Displays the impact of temperature on sales performance over
time.
o Key Insights: Warmer periods seem to align with peaks in sales,
suggesting seasonal effects (AVG High Temp Low Sales).
Interactive Features:
Effect Factor Arrows:
Yellow Arrow (Left): Directs the user to Analysis
Red Home (Right): Allows quick navigation to other overview section.
Purpose and Usage:
This page is designed to allow Amazon's sales team to analyze the performance
of stores and departments in response to external factors. By breaking down
sales data across key metrics and offering interactive filters, users can gain
insights into how variables such as fuel prices, unemployment rates, and CPI
affect sales. It helps in identifying opportunities for boosting sales in specific
conditions and guides strategic decisions regarding promotions and store
operations.