تحليل بيانات شركة مستحضرات تجميل | Skincare Analysis Using Power Bi
تفاصيل العمل
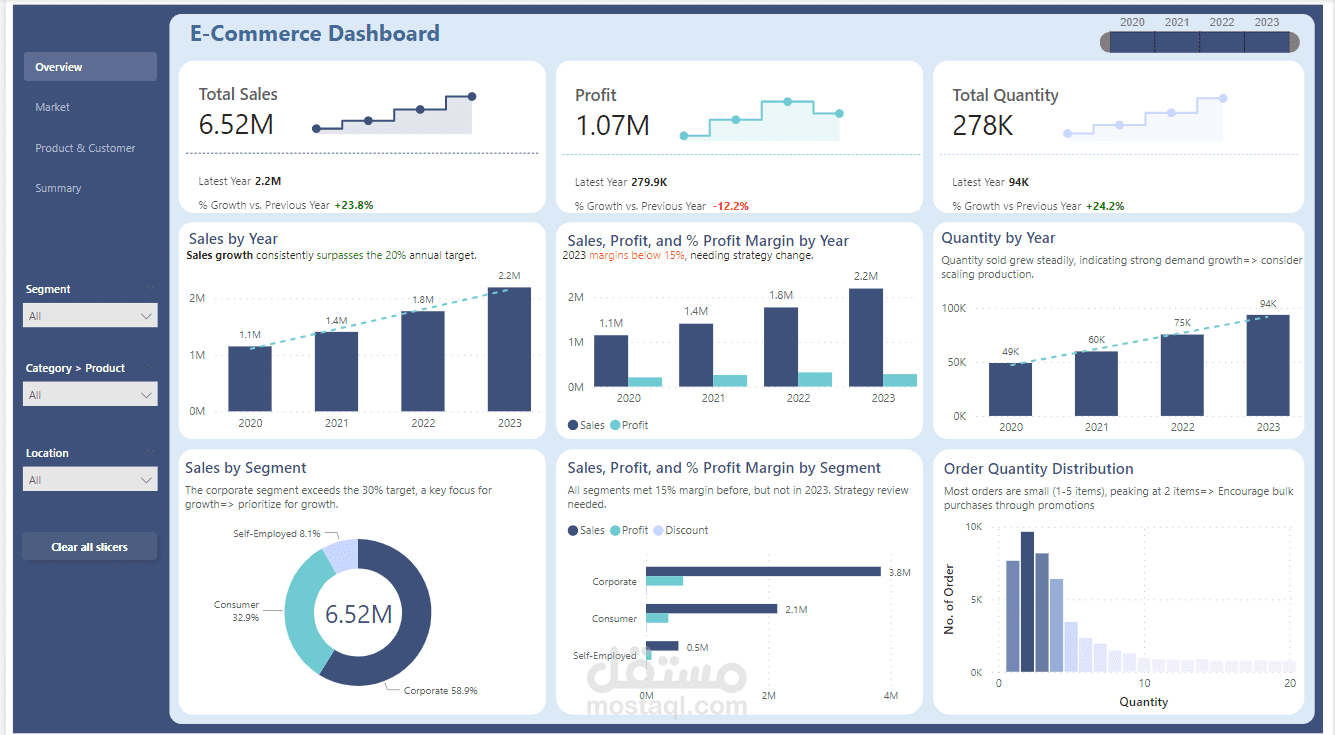
Overview of the Skincare Company E-commerce Dashboard
Key Performance Indicators (KPIs)
Sales and Revenue: Total sales, sales by region, sales by product category, profit margins
Customer Behavior: Customer churn rate, customer lifetime value, repeat purchase rate
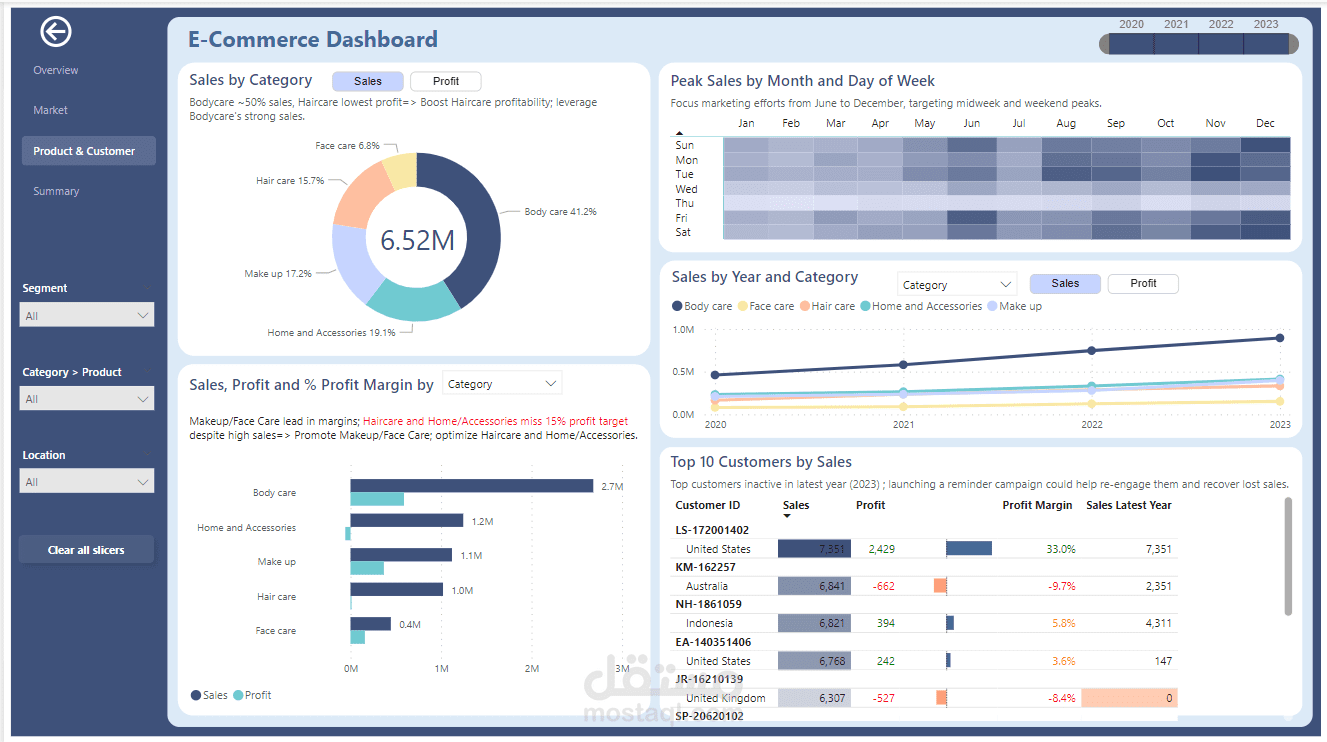
Product Performance: Best-selling products, product return rate, product reviews
Marketing and Acquisition: Website traffic, conversion rate, cost per acquisition (CPA)
Visualizations
Line charts: Sales trends over time, customer acquisition cost trends
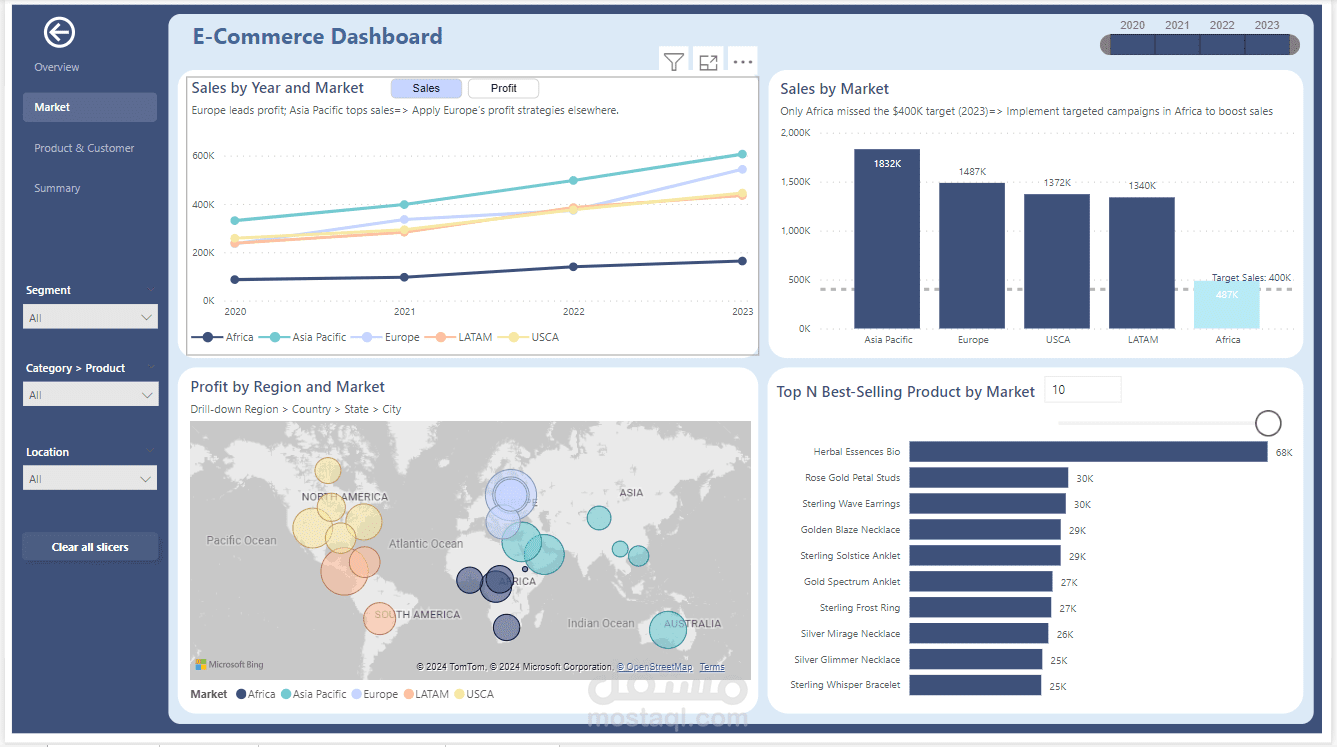
Bar charts: Sales by product category, sales by region, profit margins
Pie charts: Market share by competitor, customer demographics
Maps: Sales and profit by region
Dashboards: Consolidated view of key metrics
Key Findings
Sales and Profit: The company has experienced steady growth in sales across all regions, with Asia Pacific leading in sales and Europe leading in profit. Skincare products have the highest profit margins, while makeup and face care have lower margins despite high sales.
Customer Behavior: The company has a relatively high customer churn rate, with top customers inactive in the latest year. Repeat purchase rates vary by region.
Product Performance: Herbal Essences is the best-selling product, followed by Rose Gold Petal Studs. Skincare products have the highest sales and profit margins.
Marketing and Acquisition: The company has successfully acquired new customers, but the cost per acquisition (CPA) should be monitored to ensure profitability.
Recommendations
Optimize Product Mix: Focus on high-margin skincare products and consider adjusting the product mix in regions with lower profit margins.
Improve Customer Retention: Implement strategies to reduce customer churn and encourage repeat purchases.
Expand into New Markets: Target Africa for growth and explore opportunities in other regions.
Optimize Marketing Efforts: Analyze customer behavior and tailor marketing campaigns to specific regions and product categories.
Overall, the dashboard provides a comprehensive view of the skincare company's performance and identifies areas for improvement. By implementing the recommended actions, the company can optimize its product mix, enhance customer retention, expand into new markets, and improve overall profitability.
بطاقة العمل
| اسم المستقل | Mohamed R. |
| عدد الإعجابات | 0 |
| عدد المشاهدات | 7 |
| تاريخ الإضافة |