UK Train Data Management with Power BI
تفاصيل العمل
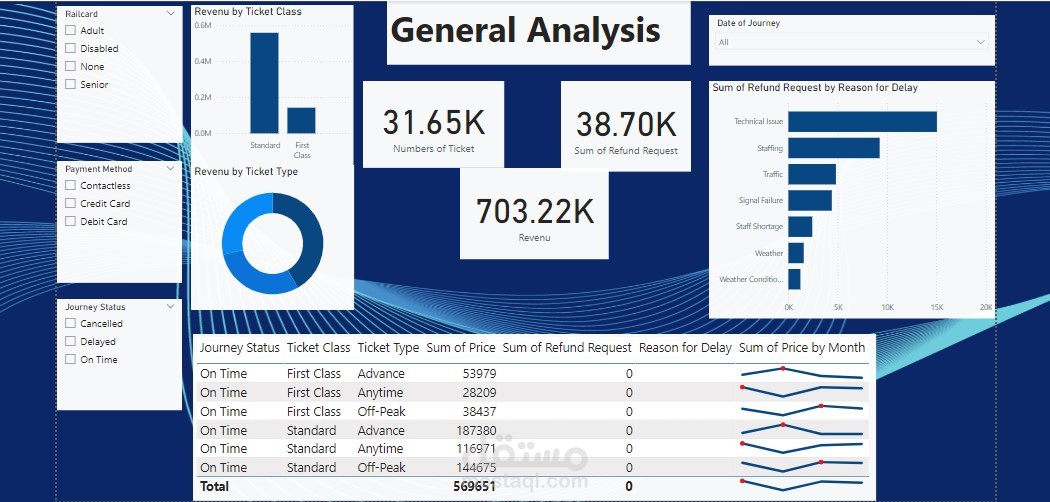
This Power BI report focuses on visualizing and analyzing UK train data to enhance operational efficiency, improve customer satisfaction, and support strategic decision-making within the railway industry. The dashboard provides key insights into various aspects of train operations, including performance, passenger statistics, and service disruptions.
Objective:
The primary goal of this dashboard is to provide railway operators, planners, and management with a comprehensive overview of train performance metrics, enabling them to identify trends, monitor service quality, and make data-driven improvements.
Key Metrics:
Train Punctuality: Percentage of trains arriving and departing on time versus those that are delayed, categorized by routes and timeframes.
Passenger Volume: Total number of passengers using the trains over specific periods (daily, weekly, monthly), including peak travel times.
Service Disruptions: Analysis of train cancellations and delays, including reasons (e.g., technical issues, weather conditions) and their impact on service.
Revenue Analysis: Breakdown of ticket sales and revenue generated from different routes and services, helping to identify profitable segments.
Safety Incidents: Tracking incidents and accidents on the rail network, categorized by severity and location.
Data Visualizations:
Line Charts: Displaying trends in train punctuality and passenger volume over time, enabling users to identify patterns and peaks.
Bar Charts: Comparing service disruptions by cause or location to highlight areas needing attention.
Maps: Visualizing train routes, delays, and incidents geographically to identify hotspots and facilitate targeted improvements.
Pie Charts: Showing the distribution of revenue across different routes or services, helping stakeholders understand financial performance.
KPI Tiles: Highlighting key metrics such as overall punctuality percentage, total passenger count, and revenue figures.
Actionable Insights:
Operational Improvements: Identifying patterns in delays and service disruptions to implement corrective measures and enhance operational efficiency.
Customer Experience Enhancements: Analyzing passenger volume data to optimize schedules and services based on demand, improving overall customer satisfaction.
Strategic Planning: Utilizing revenue analysis to inform investment decisions and marketing strategies for various routes.
This UK Train Data Management Dashboard empowers railway operators and stakeholders with the insights necessary to enhance service delivery, improve operational performance, and ultimately ensure a safer, more efficient rail network for passengers.