Road Accident Analysis with Excel
تفاصيل العمل
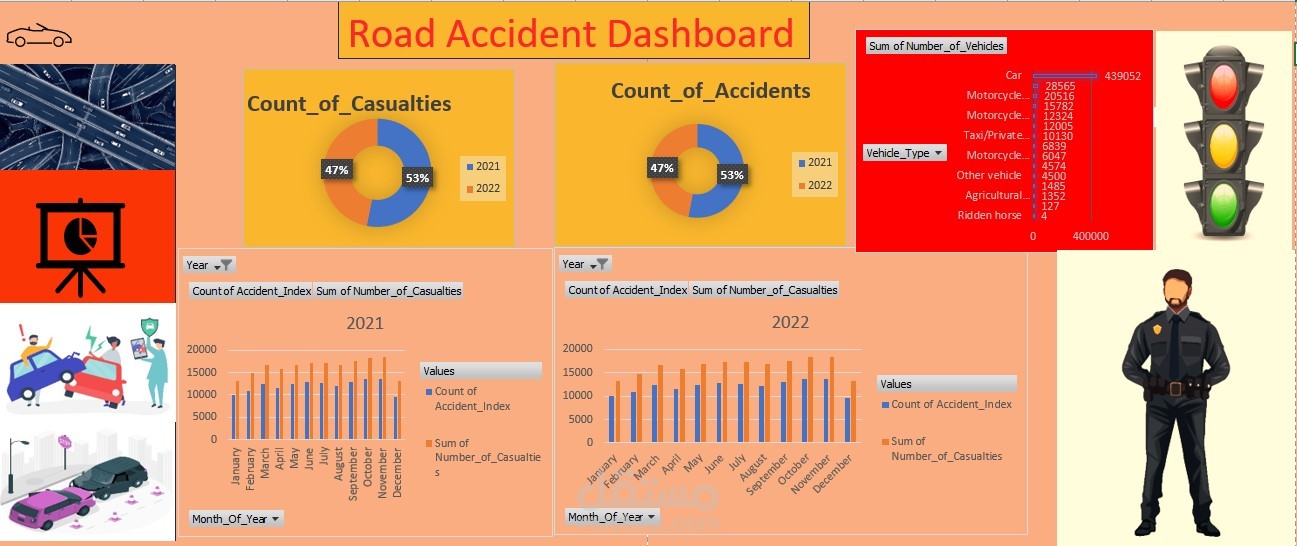
This Excel-based report focuses on analyzing road accident data to identify trends, understand causes, and develop strategies for improving road safety. The use of Excel allows for easy manipulation of data, comprehensive analysis, and visual representation of key findings.
Objective:
The primary aim of this analysis is to examine various dimensions of road accidents, including frequency, severity, contributing factors, and temporal patterns, to aid stakeholders in making informed decisions about road safety initiatives.
Key Metrics:
Total Accidents: The cumulative number of road accidents recorded over a specific period (daily, monthly, annually).
Accident Severity: Categorization of accidents based on severity (minor, serious, fatal) to assess their impact on public safety.
Causes of Accidents: Identification and breakdown of common causes (e.g., driver error, weather conditions, mechanical failures) contributing to road incidents.
Geographic Distribution: Mapping the locations of accidents to identify hotspots or areas with higher accident rates.
Temporal Patterns: Analysis of accidents based on time of day and day of the week to pinpoint peak times for incidents.
Data Visualizations:
Pivot Tables: To summarize and analyze large datasets, allowing users to filter and view accident data by various dimensions such as location, severity, and cause.
Charts:
Column Charts: To compare the number of accidents by severity and cause, highlighting key areas for intervention.
Line Graphs: To show trends in road accidents over time, identifying increases or decreases in incidents.
Pie Charts: To visualize the distribution of accident causes, making it easier to see the proportion of each category.
Heatmaps: Using conditional formatting to create heatmaps within the data to visually represent accident frequency by location or time.
Actionable Insights:
Data-Driven Recommendations: Identifying high-risk areas and times to inform targeted safety campaigns, law enforcement focus, and infrastructure improvements.
Policy Development: Assisting local authorities in developing policies aimed at reducing accidents based on identified patterns and causes.
Community Awareness: Providing insights that can be used to educate the community on safe driving practices, especially in areas identified as accident hotspots.
This Road Accident Analysis using Excel empowers users with the tools and insights necessary to understand the complexities of road accidents, ultimately fostering improved road safety measures and informed decision-making.