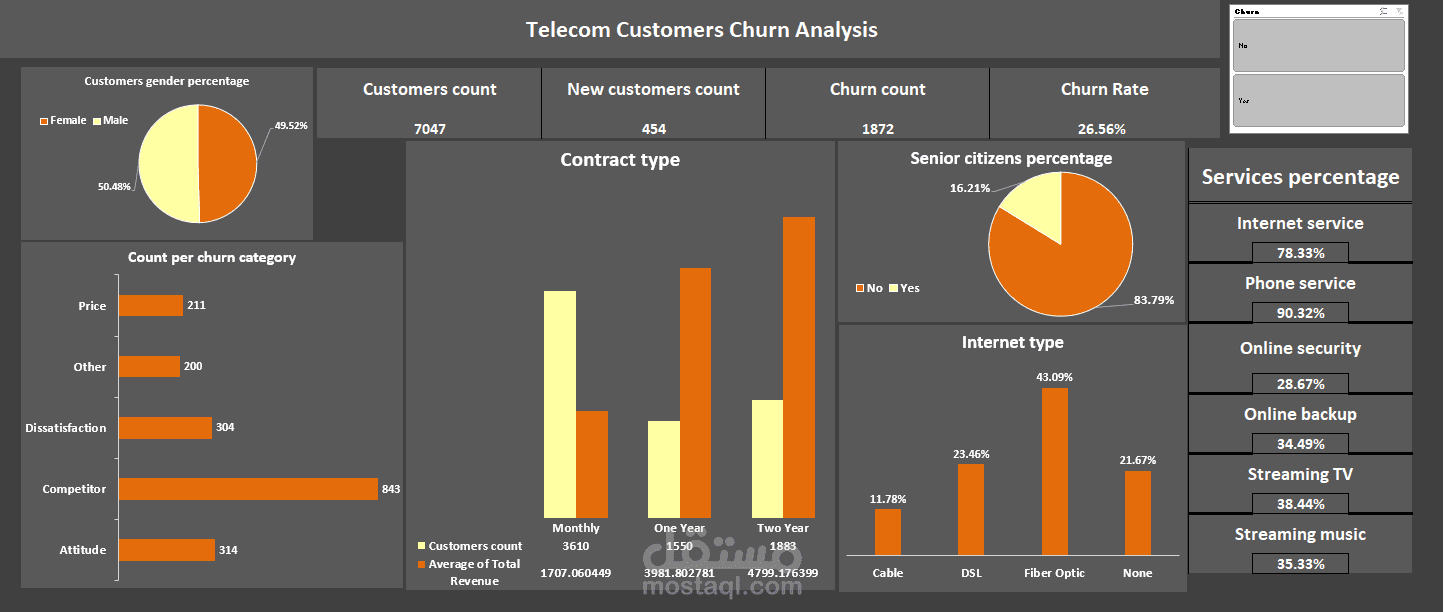
Customer Churn Analysis
تفاصيل العمل
First, I understand the date.
Second, I do some data cleansing.
Third, the encoding to make the data suitable for the regression model.
Fourth, come up with the visualizations and derive some insights.
Finally, create the final dashboard including the developed visualizations.
The application I used is Excel.
ملفات مرفقة
بطاقة العمل
| اسم المستقل | Eslam W. |
| عدد الإعجابات | 0 |
| عدد المشاهدات | 7 |
| تاريخ الإضافة | |
| تاريخ الإنجاز |
