Walmart Analysis using Power BI
تفاصيل العمل
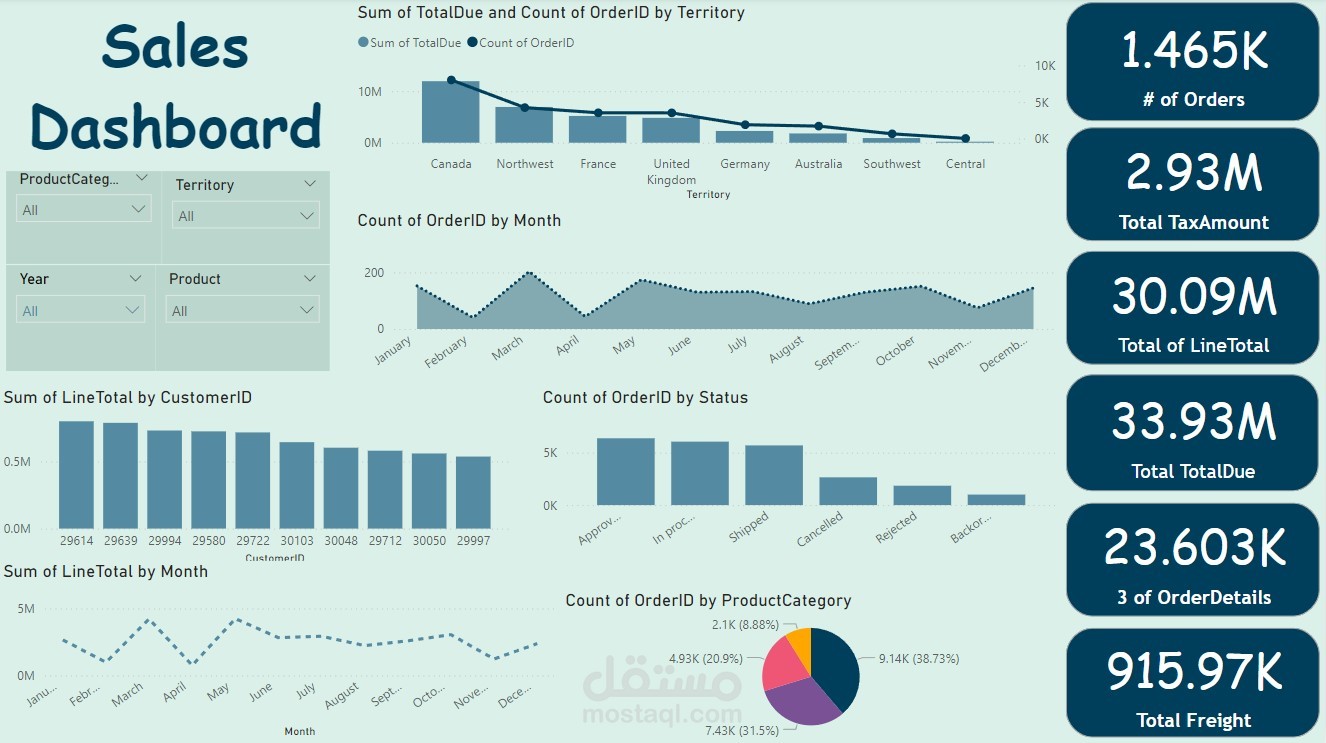
This Power BI Sales Dashboard provides a comprehensive overview of key sales metrics, enabling detailed analysis and insights into the sales performance across different regions, time periods, and customer segments.
Key Features: Territory Analysis:
The top-left bar and line chart visualize the Sum of TotalDue and Count of OrderID by Territory. This dual-axis chart helps in comparing the total revenue generated and the number of orders placed across different territories, highlighting regions like Canada and Northwest with significant contributions to the overall sales. Order Trend Over Time:
The line chart in the top-middle section shows the Count of OrderID by Month. It provides a clear view of the monthly order trends, helping identify peak sales periods and potential seasonal variations. Sales by Customer:
The bar chart at the bottom left illustrates the Sum of LineTotal by CustomerID. This chart is useful for identifying top customers in terms of total sales, offering insights into customer behavior and sales concentration. Order Status Breakdown:
The bar chart at the center right displays the Count of OrderID by Status. It categorizes orders into various statuses such as Approved, In Process, Shipped, Cancelled, Rejected, and Backordered, allowing users to monitor the order fulfillment process and identify any bottlenecks or issues. Monthly Sales Trend:
The line chart at the bottom center presents the Sum of LineTotal by Month. This visualization highlights the overall sales performance month-over-month, helping to track progress and compare performance against previous months. Product Category Distribution:
The pie chart at the bottom right shows the Count of OrderID by ProductCategory. It provides a quick overview of how orders are distributed among different product categories, revealing the most popular categories and their share of total orders. KPI Cards:
The dashboard includes several key performance indicator (KPI) cards on the right side, displaying the following metrics:
of Orders (1.465K): The total number of orders processed.
Total TaxAmount (2.93M): The total amount of tax collected from sales. Total of LineTotal (30.09M): The cumulative sales revenue. Total TotalDue (33.93M): The total amount due, including tax and other charges.
of OrderDetails (23.603K): The total number of order details or line items.
Total Freight (915.97K): The total freight cost associated with orders. Insights and Usage: This dashboard is designed to provide sales managers and business analysts with actionable insights into the company's sales performance. By exploring the various visualizations, users can identify trends, evaluate regional performance, monitor customer contributions, and assess the efficiency of the sales process. The inclusion of filters such as Product Category, Territory, Year, and Product allows for tailored analysis to address specific business questions and strategic decision-making.
