coffee shop sales analysis Dashboard
تفاصيل العمل
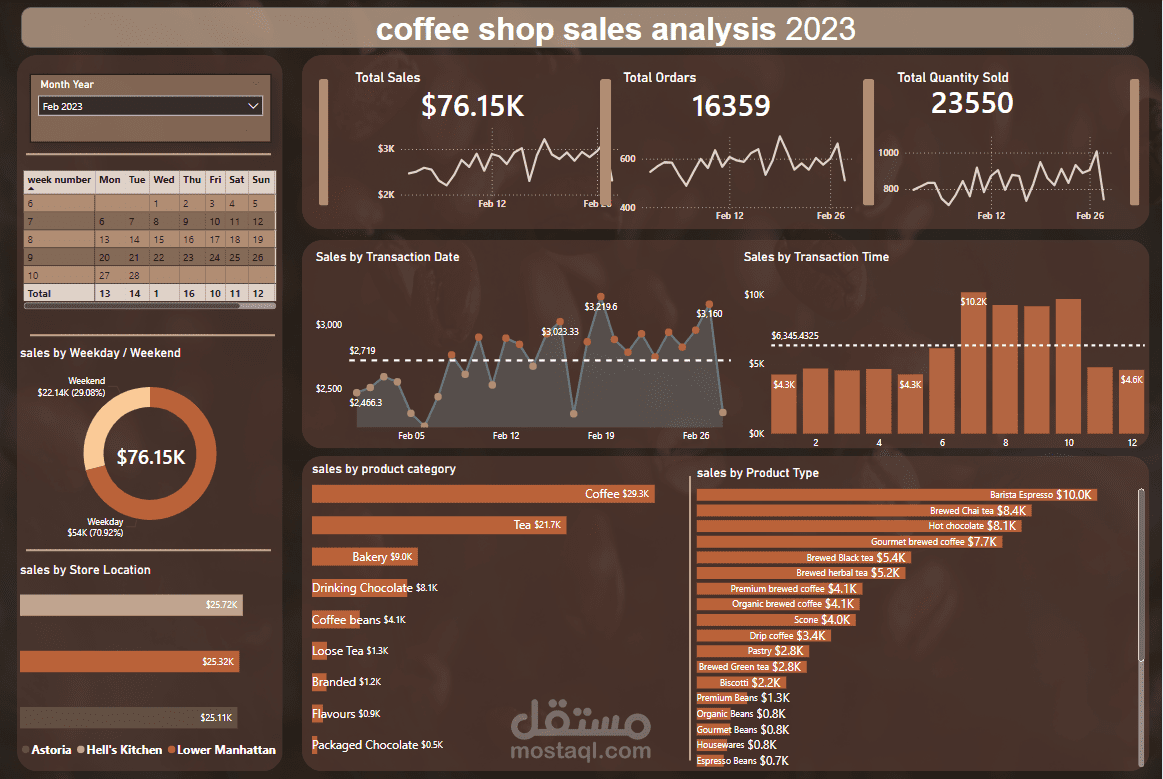
1. Overview
This project involved analyzing sales data from a coffee shop to uncover key business insights and trends. The analysis aimed to provide actionable recommendations to improve sales performance and operational efficiency.
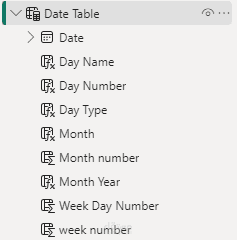
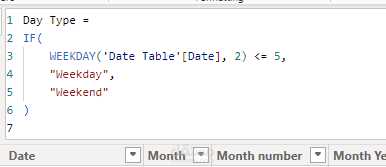
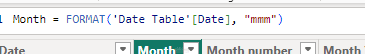
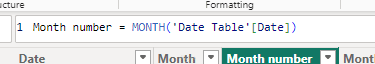
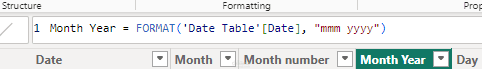
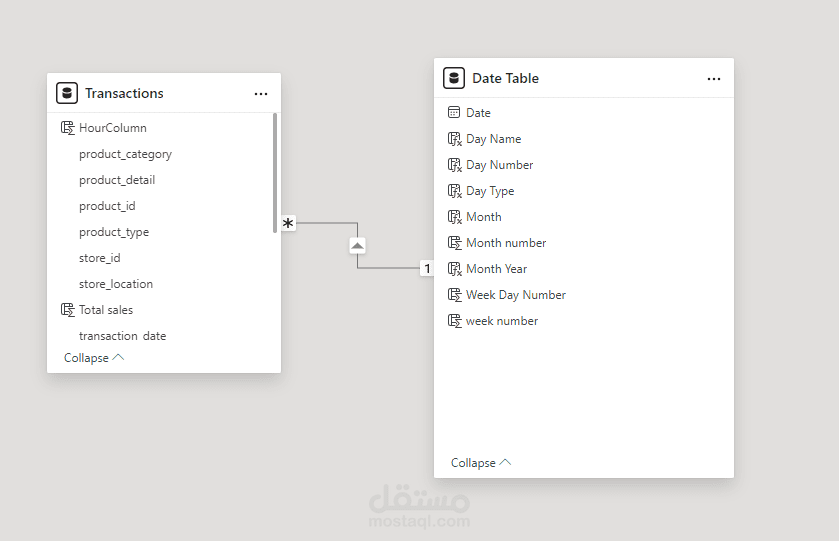
create Date Table from column transaction_date
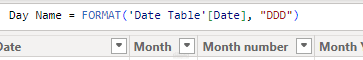
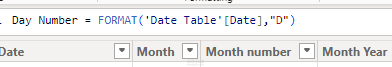
Here are some of the transformations which I have performed as per requirement using DAX:
Data Modeling:
2. Ask
The objective of this project was to analyze the coffee shop’s sales data to answer critical business questions, including:
Sales Trends Over Time:
What are the sales trends over different time periods (daily, weekly, monthly)?
Are there any seasonal patterns in the sales data?
2. Product Performance:
Which products are the best sellers?
What is the sales contribution of each product category?
Are there any products with declining sales?
3. Customer Behavior:
What are the peak hours for sales?
How does customer purchasing behavior change throughout the day?
4. Revenue Insights:
What are the revenue trends?
How do discounts or promotions affect sales and revenue?
3. Approach
Data Preparation
Tools Used: Power BI, Power Query
Steps Taken:
Imported raw sales data into Power Query for initial cleaning and transformation.
Created calculated fields, including date and time fields, to facilitate analysis.
Generated a Date Table using DAX to support time series analysis.
Data Exploration
Tools Used: Power BI (instead of Excel PivotTables)
Analysis Performed:
Sliced and diced the data to uncover sales trends, product performance, and customer behavior patterns.
Used time series analysis to identify trends across different periods.
Conducted product-level analysis to assess the performance of individual items and categories.
Visualization
Tools Used: Power BI
Dashboard Design:
Created dynamic and interactive dashboards using Power BI’s visualization tools.
Included key metrics, such as total sales, top-selling products, and sales by time of day.
Designed user-friendly dashboards to allow stakeholders to explore the data interactively.
4. Insights & Recommendations
Key Insights:
Sales Trends: Identified a significant seasonal spike in sales during the winter months, suggesting a higher demand for hot beverages.
Product Performance: Discovered that a small percentage of products contributed to the majority of sales, indicating a need to focus on these key items.
Customer Behavior: Found that the coffee shop experienced peak sales during the morning rush hours, aligning with customer workday schedules.
Recommendations:
Product Focus: Increase promotion and inventory for best-selling products, especially during peak seasons.
Operational Efficiency: Adjust staffing levels to match peak sales hours, improving customer service and reducing wait times.
Marketing Strategy: Develop targeted marketing campaigns for the winter season to capitalize on increased demand.
5. Conclusion
This project successfully analyzed the coffee shop’s sales data, providing valuable insights and actionable recommendations to enhance business performance. The use of Power BI enabled efficient data transformation, in-depth analysis, and the creation of interactive dashboards, making the findings accessible and practical for decision-makers.