analysis of movies views from top250 website
تفاصيل العمل
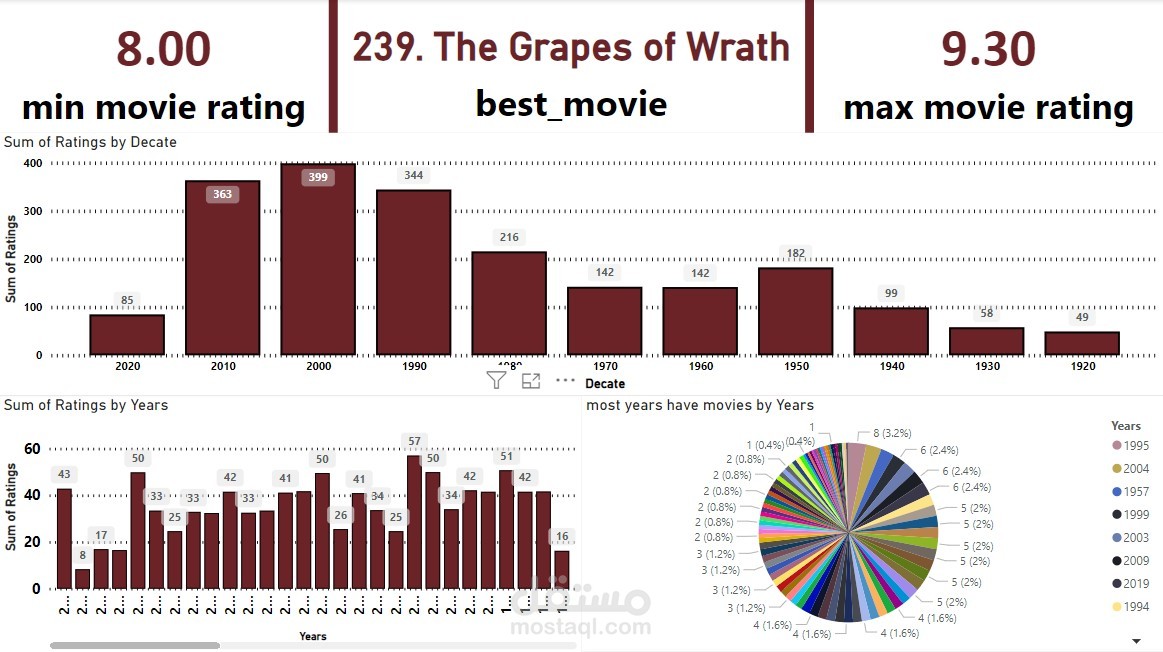
The project focuses on analyzing movies based on ratings from a top 250 movie website. The analysis involves visualizing data to gain insights into movie ratings, trends over decades, and yearly distributions
Key Visuals:
Min and Max Movie Ratings:
Display the minimum and maximum ratings among the top 250 movies.
The min rating displayed is 8.00 and the max rating is 9.30.
Best Movie:
Highlight the movie with the highest rating. In this case, "The Grapes of Wrath" with a rating of 239.
Sum of Ratings by Decade:
A bar chart showing the sum of ratings grouped by decade.
Provides insights into which decades had the most highly-rated movies.
Sum of Ratings by Year:
A bar chart breaking down the sum of ratings for each year.
Useful for identifying trends and specific years with a concentration of top-rated movies.
Movie Distribution by Year:
A pie chart visualizing the distribution of movies across different years.
Helps in understanding which years contributed the most to the top 250 list.
Analysis Goals:
Identify the decades and years that produced the highest-rated movies.
Determine trends in movie ratings over time.
Highlight specific movies that stand out in terms of rating.
Provide insights for movie enthusiasts or critics interested in understanding the evolution of top-rated films.