Tableau Sales Performance Dashboard
تفاصيل العمل
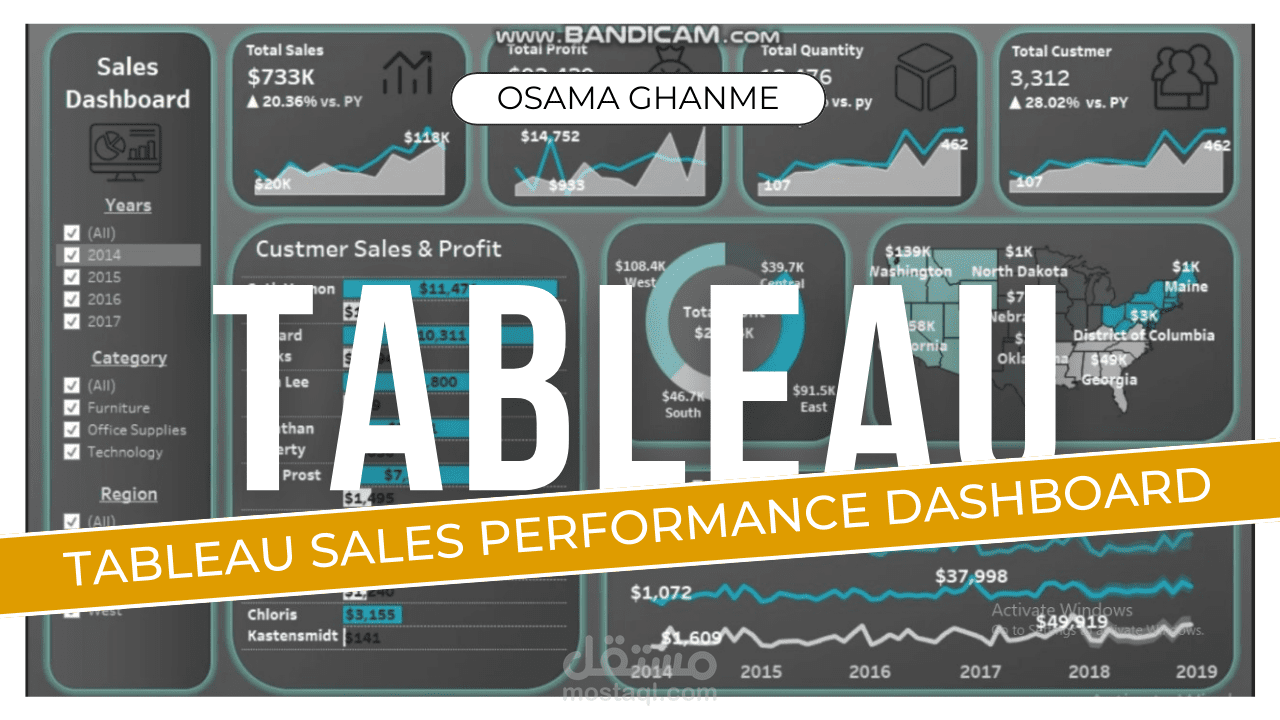
I developed an interactive performance tracker dashboard using Tableau, specifically designed to track insights from a Sales Excel file. The dashboard is clean, user-friendly, and provides valuable insights for the client. Below are the key features and benefits of the dashboard, along with detailed implementation stages and tasks performed.
Implementation Stages and Tasks Performed:
1. Data Collection and Preparation:
- Task: Collected sales data from the client's Excel file.
- Task: Cleaned and transformed the data to ensure consistency and accuracy.
- Task: Imported the cleaned data into Tableau for further analysis.
2. Data Modeling:
- Task: Created a structured data model in Tableau to support efficient querying and reporting.
- Task: Defined relationships between different data fields to enable comprehensive analysis.
3. Dashboard Design:
- Task: Designed a clean and intuitive interface to ensure ease of use for all users.
- Task: Incorporated interactive elements, such as filters and drill-downs, to allow users to explore data in depth.
4. Visualization Development:
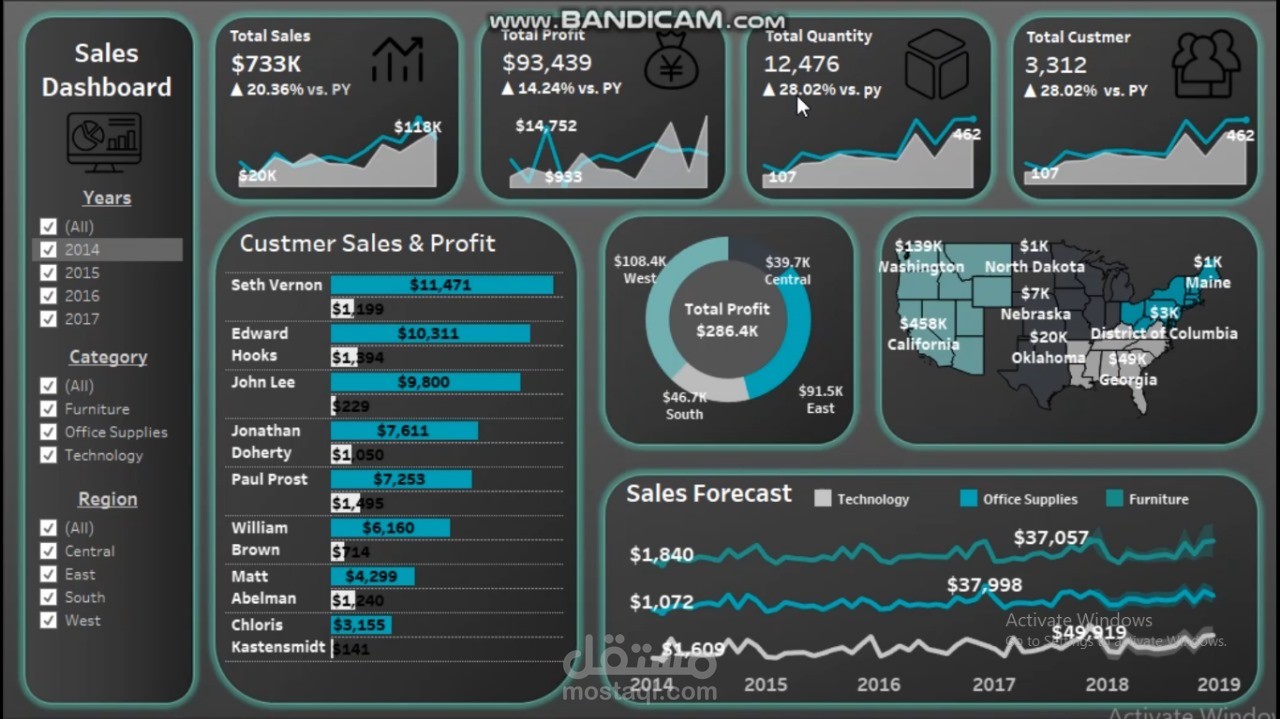
- Task: Developed visualizations for key sales metrics, such as total sales, sales growth, and sales targets.
- Task: Created dynamic charts and graphs that update in real-time based on user selections.
- Task: Designed detailed insights into sales performance by product, region, and salesperson.
5. Customization and Testing:
- Task: Customized views to focus on specific metrics or time periods based on client requirements.
- Task: Conducted thorough testing to ensure the dashboard's functionality and accuracy.
Key Features:
1. Sales Performance Tracking:
- Visualizes key sales metrics, such as total sales, sales growth, and sales targets.
- Tracks performance over different time periods, including daily, monthly, and yearly views.
2. User-Friendly Design:
- Clean and intuitive interface ensuring ease of use for all users.
- Interactive elements, such as filters and drill-downs, allow users to explore data in depth.
3. Detailed Insights:
- Provides detailed insights into sales performance by product, region, and salesperson.
- Identifies trends, patterns, and outliers in the sales data.
4. Customizable Views:
- Users can customize views to focus on specific metrics or time periods.
- Dynamic charts and graphs that update in real-time based on user selections.
Benefits:
1. Enhanced Decision-Making:
- Empowers the client to make informed decisions based on comprehensive sales data.
- Highlights key areas of strength and opportunities for improvement.
2. Improved Sales Strategy:
- Offers insights into top-performing products and regions, guiding strategic sales efforts.
- Helps in setting realistic sales targets and monitoring progress towards them.
3. Increased Efficiency:
- Streamlines the process of analyzing sales data, saving time and effort.
- Provides a centralized platform for tracking and reporting sales performance.
Final Result:
This Tableau dashboard serves as a powerful tool for the client, offering a comprehensive view of their sales data and enabling them to derive actionable insights to drive their business forward. The client now has a centralized and interactive platform for tracking and analyzing sales performance, which significantly enhances their decision-making process and strategic planning.