Dynamic Insights with Power BI through Interactive Dashboards
تفاصيل العمل
Implementation Stages and Tasks Performed:
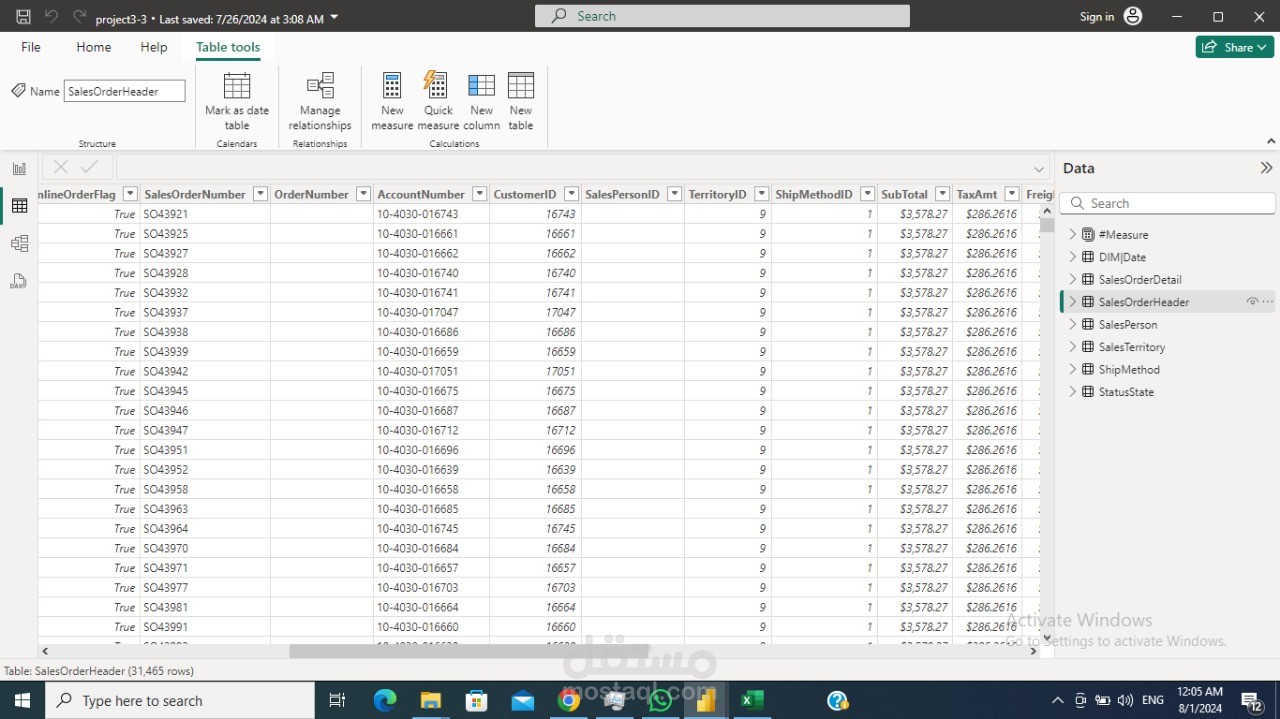
Data Extraction:
Extracted the dataset from SQL Server, ensuring comprehensive data capture.
Ensured the data was relevant and up-to-date to reflect accurate business metrics.
ETL Process:
Conducted a full ETL (Extract, Transform, Load) process in SQL Server.
Extract: Gathered raw data from various sources.
Transform: Cleaned and transformed the data to ensure consistency and accuracy.
Load: Loaded the transformed data into a centralized data warehouse for analysis.
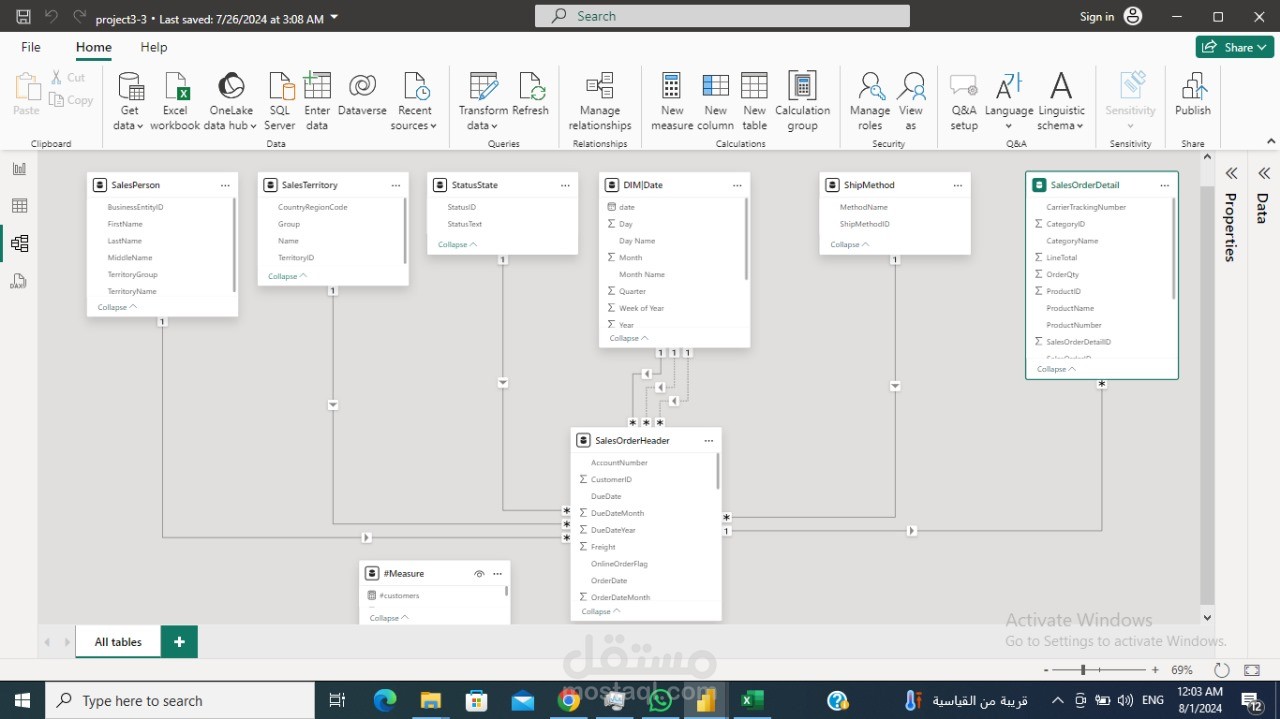
Data Modeling:
Created dimension and fact tables to develop a star schema.
Optimized the data model for efficient querying and reporting.
Ensured the data relationships were correctly defined to support accurate analysis.
Measures & Calculations:
Developed various measures and calculations to derive meaningful insights from the data.
Included calculations such as total sales, order count, and average sales per region.
Ensured that these measures were dynamically updated to reflect real-time data changes.
Dashboard Creation:
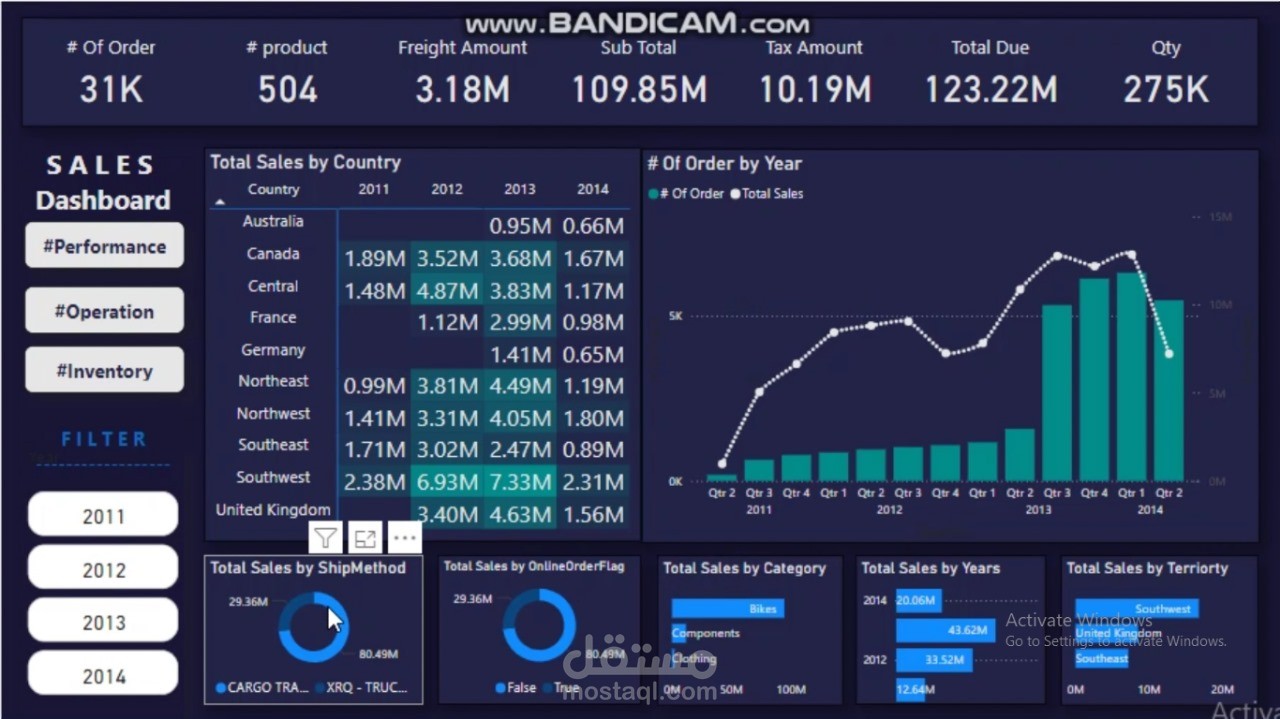
Designed a dynamic dashboard to visualize sales and operational data.
Included key metrics such as total sales, order count, and performance by region, salesperson, and product category.
Utilized Power BI's interactive capabilities to allow users to drill down into specific data points.
Ensured the dashboard was user-friendly and visually appealing, making it easy to interpret the data.
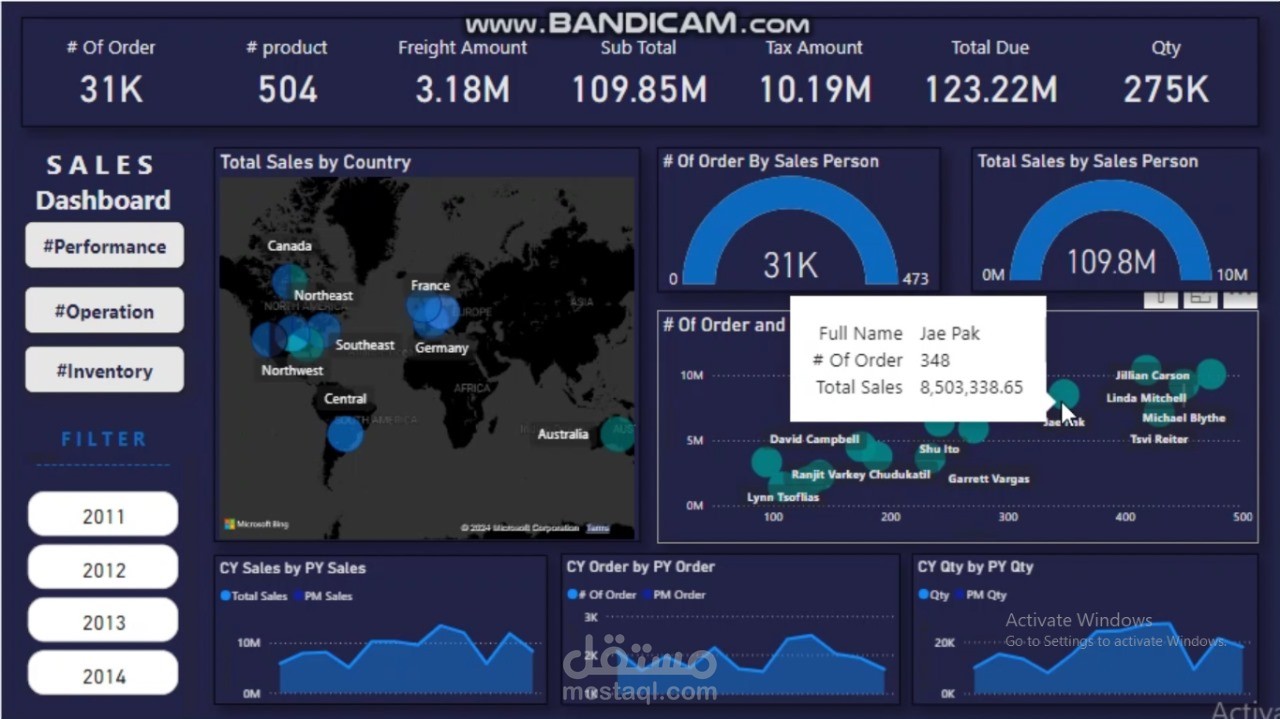
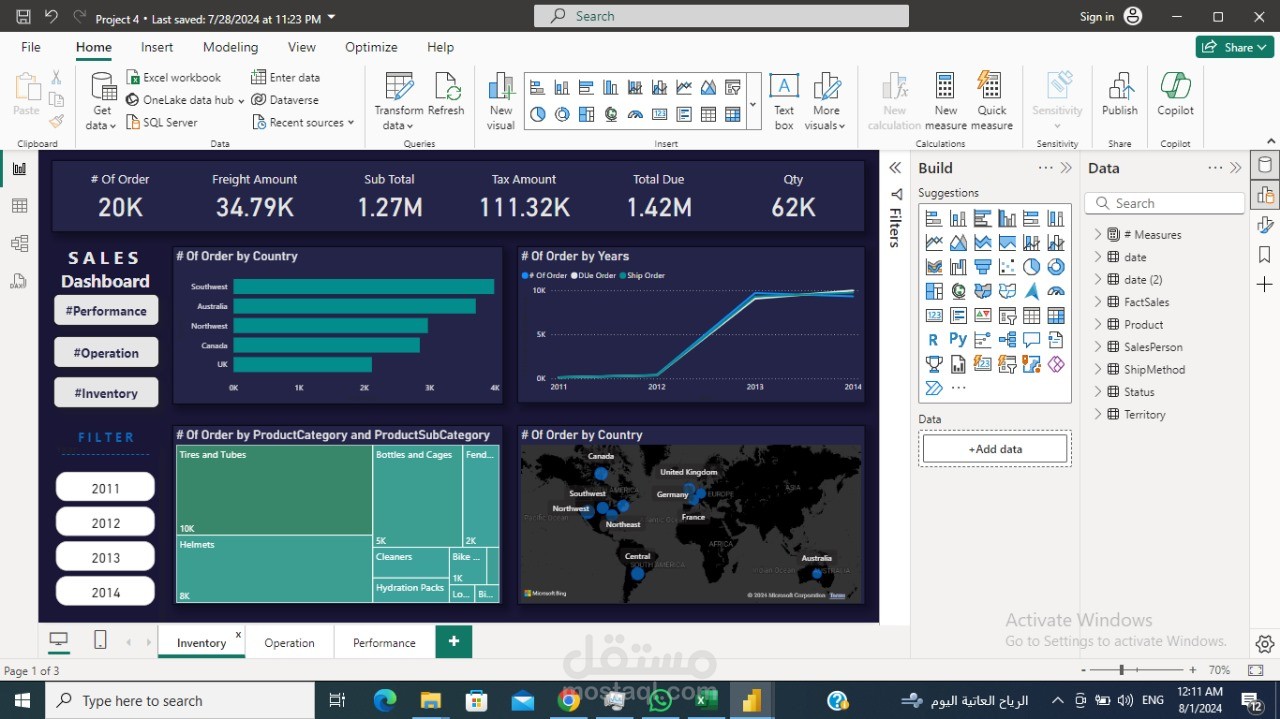
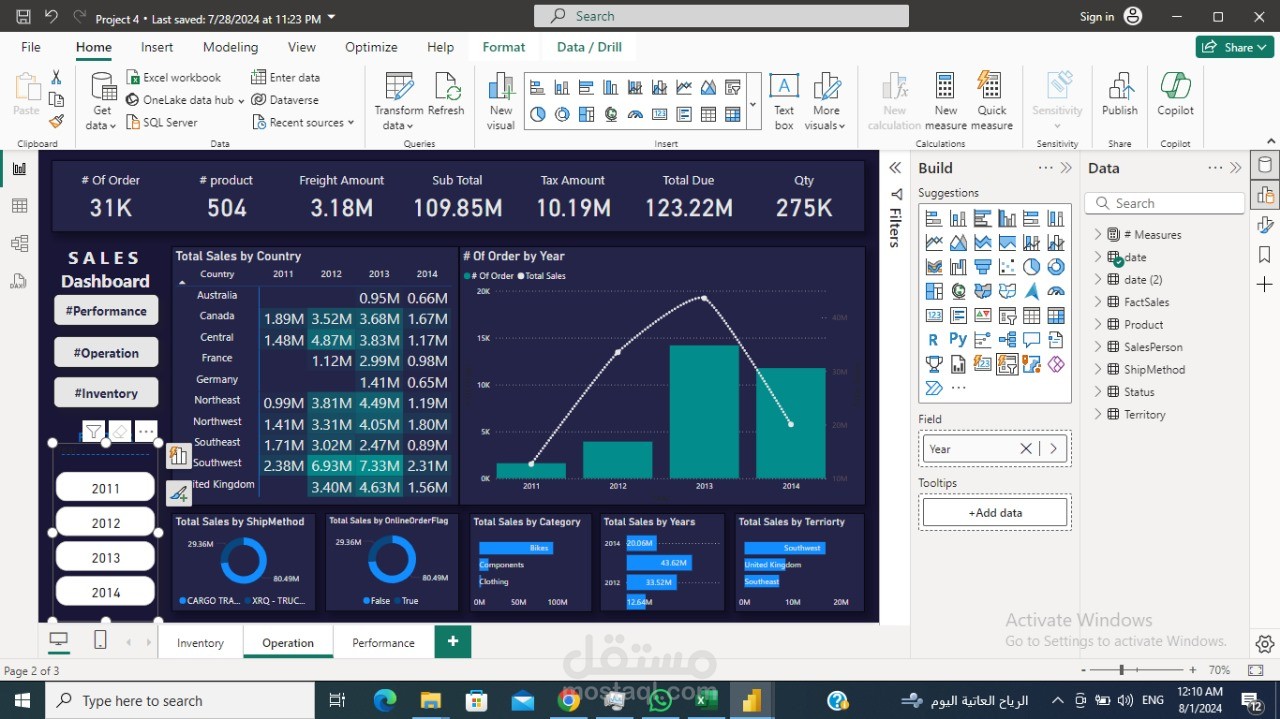
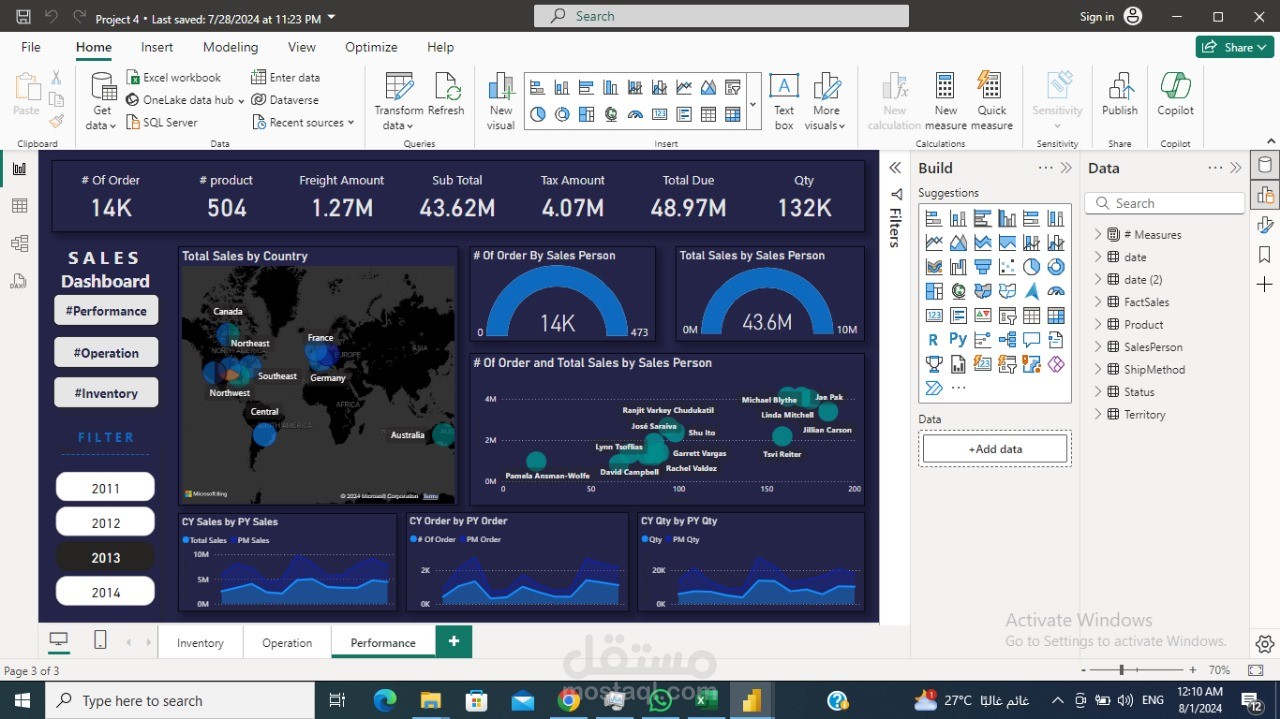
Key Features of the Dashboard:
Overall Performance: Provides a general view of areas, salespersons, order frequency, and products.
Operation Report: Focuses on sales team performance, including total sales by salesperson and sales comparison.
Inventory Report: Dedicated to inventory analysis with inventory trend and turnover ratio visuals.
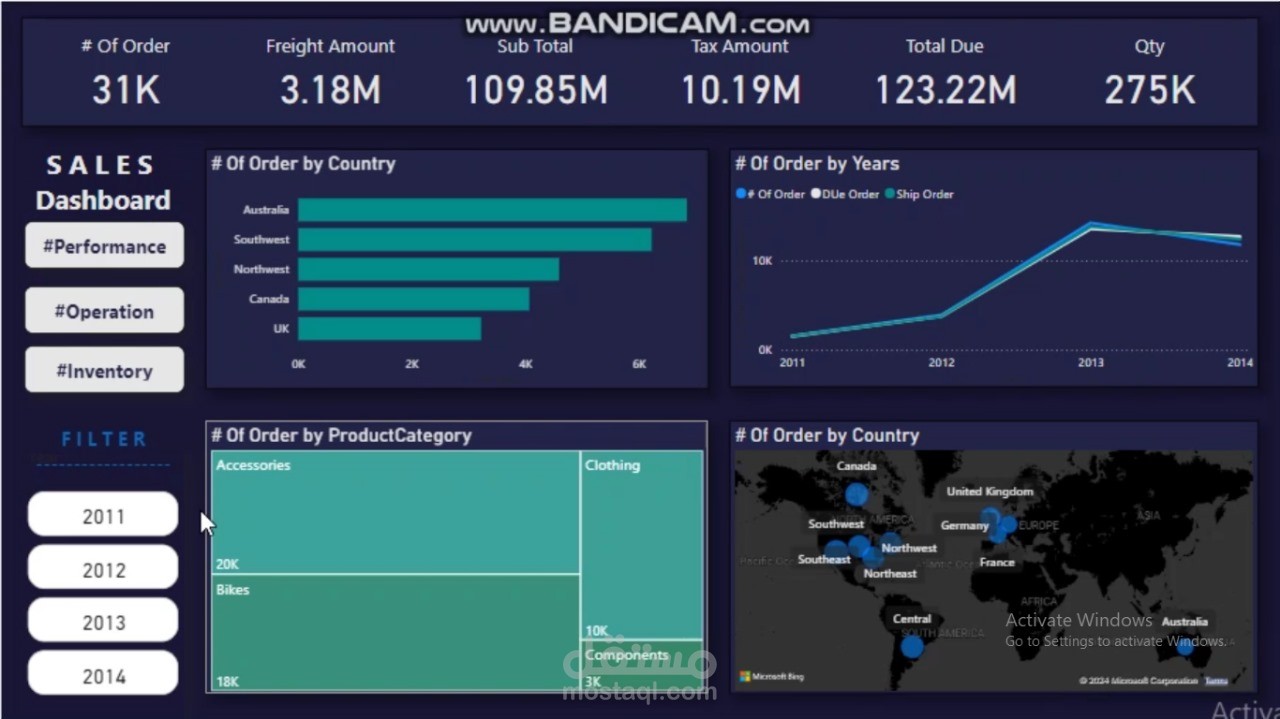
Key Insights Provided:
Regional Orders: Identify top-performing regions and areas needing improvement.
Sales Trends: Analyze sales growth over time to spot trends and seasonality.
Product Popularity: Highlight key product segments driving sales.
Sales Performance: Detail individual contributions of salespersons.
Inventory Management: Assess stock levels and efficiency to optimize inventory turnover.
Benefits:
Strategic Decision-Making: Facilitates data-driven decisions to improve business strategies.
Enhanced Performance Monitoring: Provides real-time insights into sales and operational performance.
User-Friendly Interface: Ensures stakeholders can easily navigate and interpret the data.
Final Result:
This Power BI dashboard is a powerful tool that provides comprehensive insights into sales and operational performance, helping businesses to make informed decisions and optimize their strategies effectively. The client now has a centralized and interactive platform for tracking and analyzing sales performance, significantly enhancing their decision-making process and strategic planning.