HR-Employee-Attrition
تفاصيل العمل
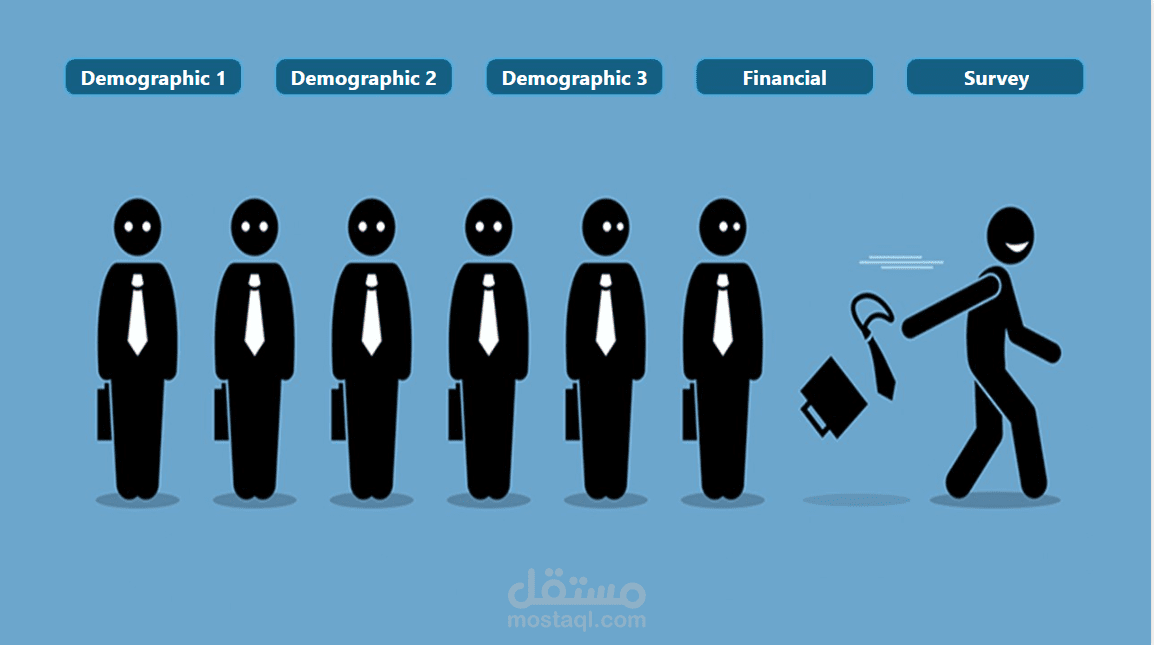
Project Main Steps
1) After importing data into Power Query, and cleaning and transforming the data (ETL) using the Power Query Editor.
2) Create relationships between tables.
3) Create a lot of measures that are used to build the report (All Employees, current Employees, Attributions Employees, % Attributions Employees, %current Employees, and average age).
Dashboard Try to answer the following questions:
1️⃣ What are current, Attributions and % Attributions by Department, Gender ,and Age Group?
2️⃣ What are current, Attributions and % Attributions by Distance from home Group?
3️⃣ What are current ,Attributions by NumCompaniesWorked and Education?
4️⃣ What are current, Attributions and % Attributions by JobLevel and MaritalStatus?
5️⃣ What are current and attributable employees by Years at Company Group, years in current role group ,and YearsSinceLastPromotion group?
6️⃣ What are current and attributable employees by monthly income group?
7️⃣ What are current and % Attributions by Total Working Years Group, TrainingTimesLastYear,OverTime , and Persent Salary hike group?
8️⃣ What are current and % Attributions by hourly rate group, daily rate group, and monthly rate Group ?
9️⃣ What are current, Attributions and % Attributions by JobSatisfaction and All Employees and % Attributions by BusinessTravel?
1️⃣0️⃣ What are current, Attributions and % Attributions by PerformanceRating, EnvironmentSatisfaction, JobInvolvement, and WorkLifeBalance?