Supermarket Products Analysis
تفاصيل العمل
Project Main Steps
1) After importing data into Power Query, and cleaning and transforming the data (ETL) using the Power Query Editor.
2) Create relationships between tables.
3) Creating the Calendar table.
4) Create a lot of measures that are used to build the report (total sales, Target, total Profit, total Quantity, total Customers, Average Order Value, and No of Orders).
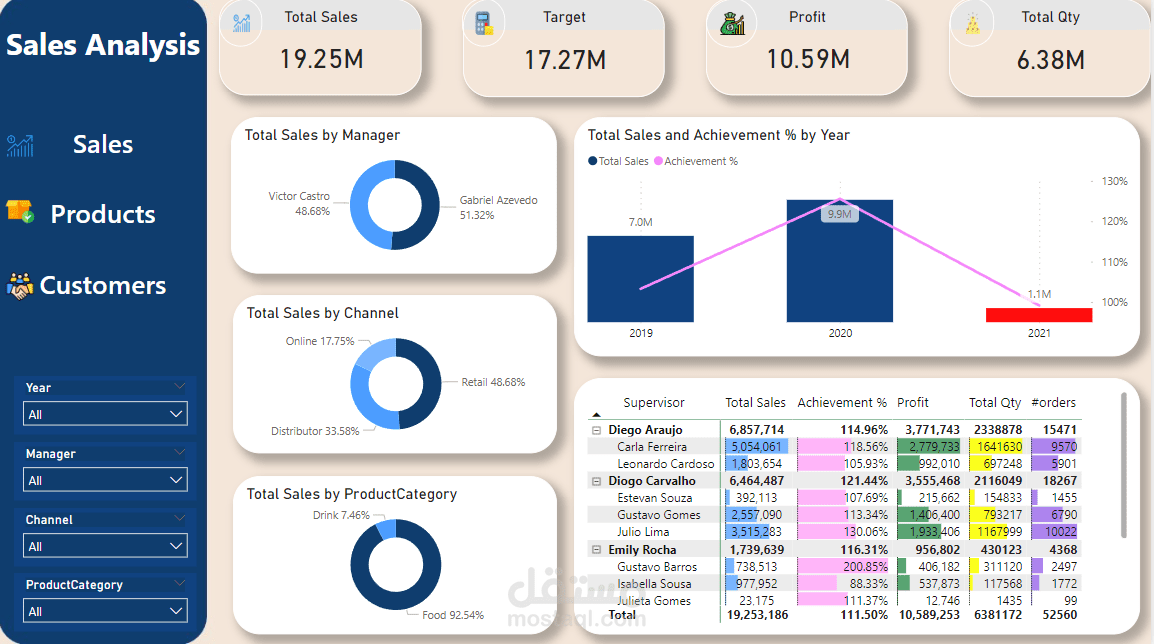
Dashboard Try to answer the following questions:
1️⃣ What are Total Sales and Achievement % by Year?
2️⃣ What are total sales by Manager, total sales by Channel, and total sales by Product Category?
3️⃣ What are Total Sales and Profit by Product Category and Total Sales and Profit by Channel?
4️⃣ What are Total Sales and Profit by Top 10 Product Group?
5️⃣ What are Total Sales And profit for the top 30 products?
6️⃣ What are Customers by Year and first order year?
7️⃣ What are Customers by Gender and Customers by Age Group?
8️⃣ What are Customers by AVg No.orders and Customers by Country?