Superstore sales data analysis project
تفاصيل العمل

In this project, I performed an in-depth analysis of product sales data to uncover key trends and insights that can drive business decisions. The dataset includes sales information across various products, regions, and time periods.
Objectives:
Data Cleaning and Preparation: Utilized Python libraries such as Pandas and NumPy to clean and prepare the dataset. This involved handling missing values, correcting data inconsistencies, and transforming data types for analysis.
Exploratory Data Analysis (EDA): Conducted EDA to identify patterns and trends in sales performance. This included analyzing sales by product category, region, and time period to understand the factors influencing sales.
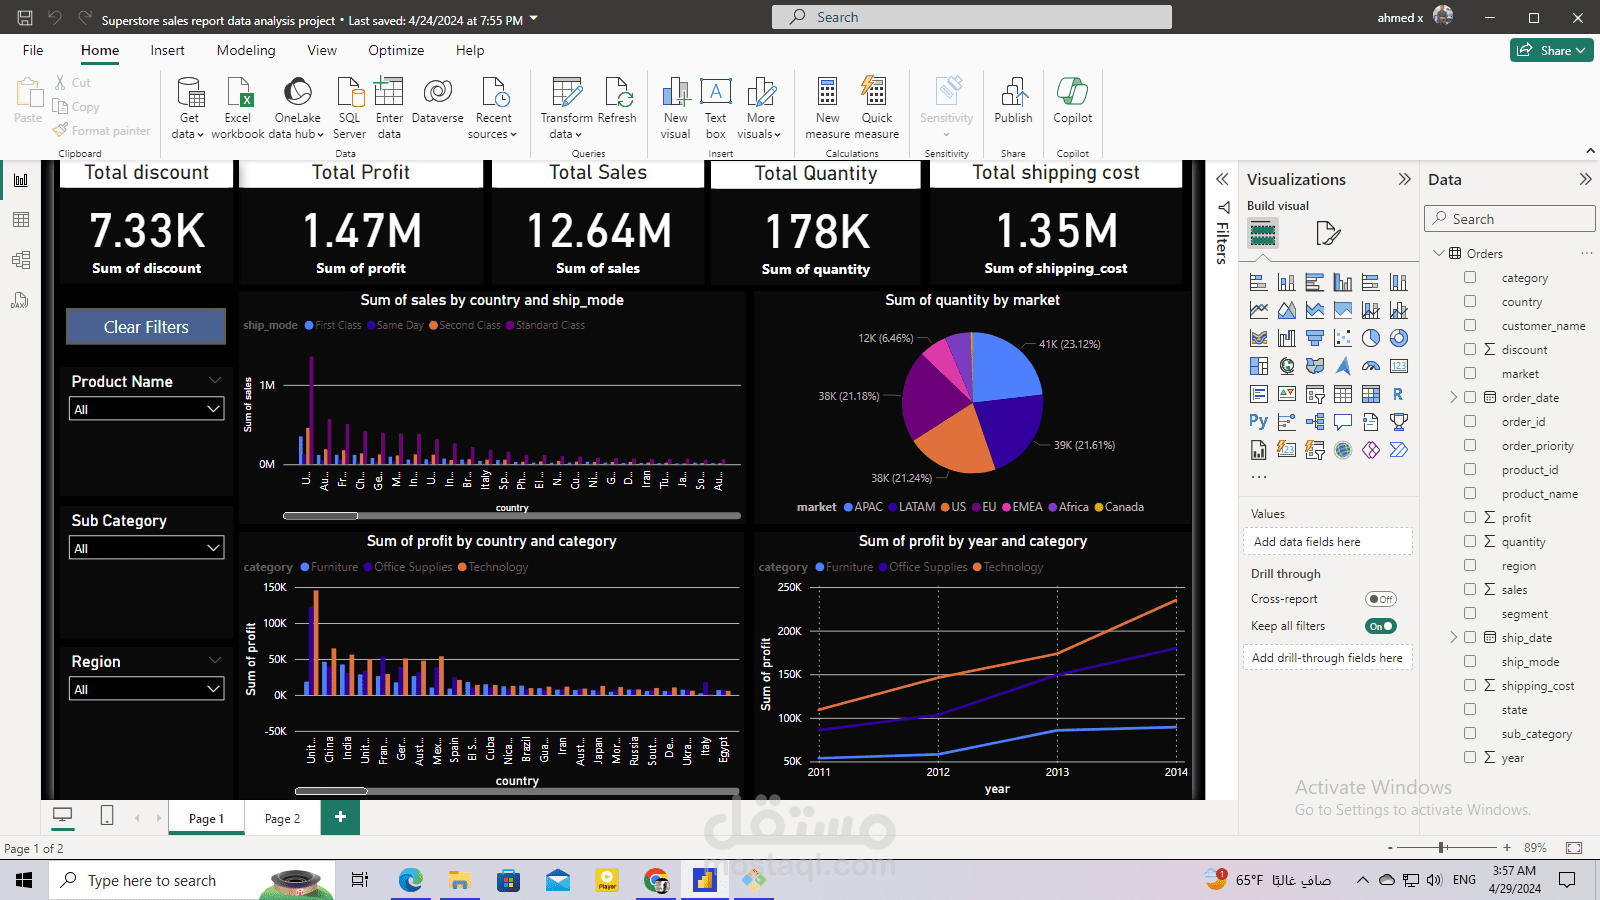
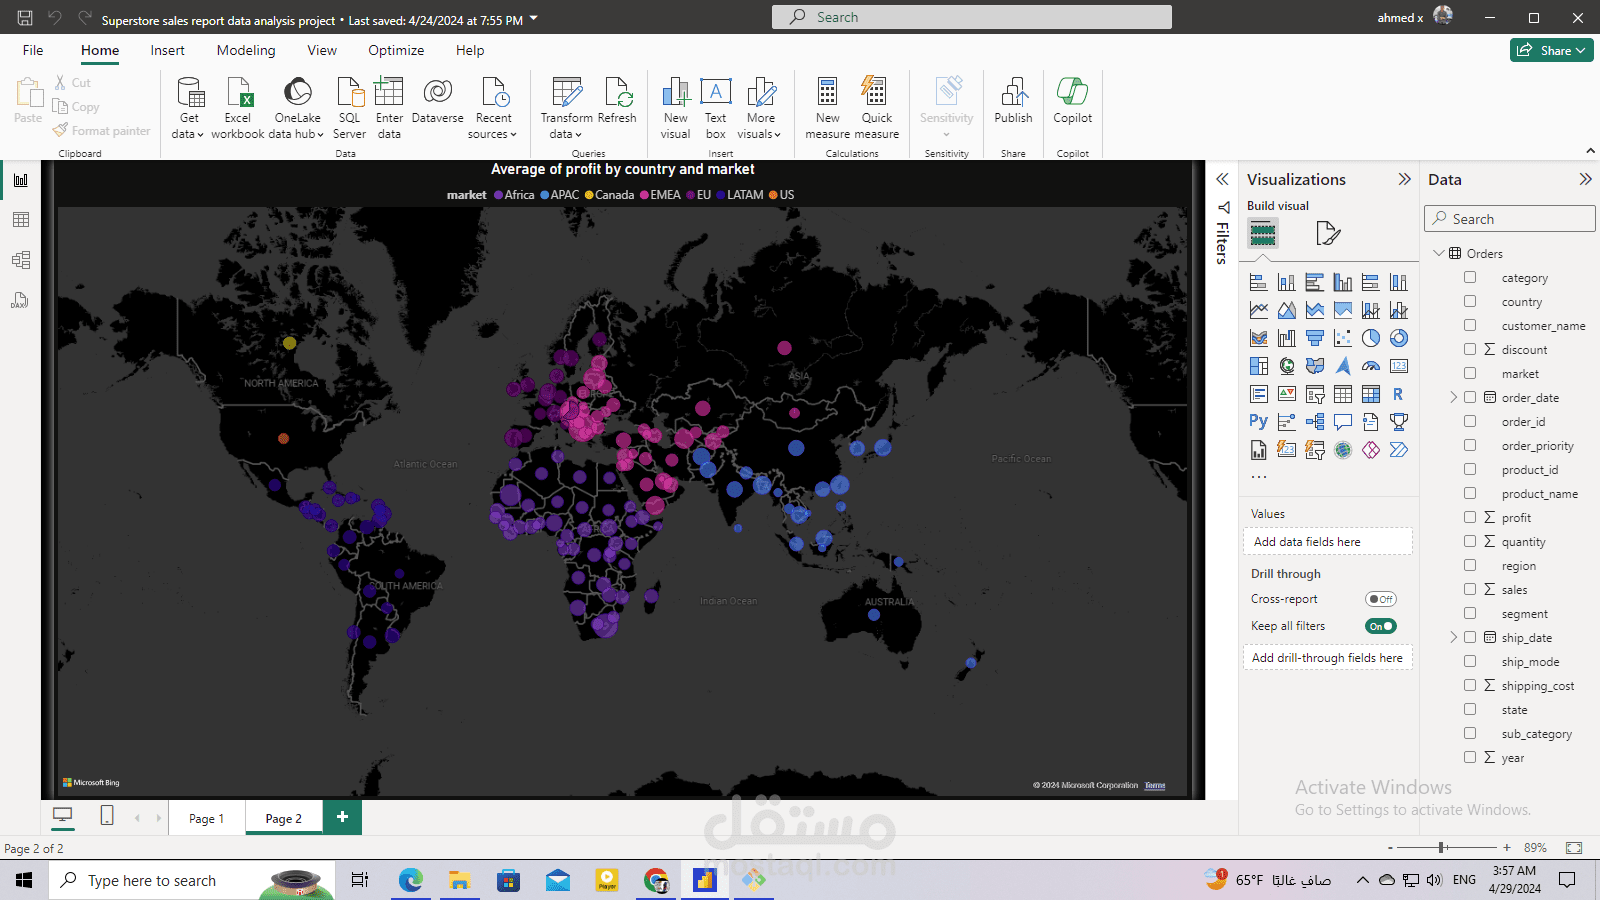
Data Visualization: Created interactive dashboards using Power BI to visualize sales trends and performance metrics. These dashboards provide a dynamic way to explore the data and gain actionable insights.
Sales Forecasting: Implemented machine learning models to forecast future sales based on historical data. This helps in planning inventory, marketing strategies, and resource allocation.
Tools and Technologies:
Python: For data cleaning, preparation, and analysis.
Pandas and NumPy: For data manipulation and numerical operations.
Power BI: For creating interactive and insightful visualizations.
Machine Learning: For sales forecasting and predictive analysis.
Key Insights:
Identified top-performing products and regions.
Analyzed seasonal trends and their impact on sales.
Discovered factors that significantly influence sales performance.