Inventory Optimization Analysis
تفاصيل العمل
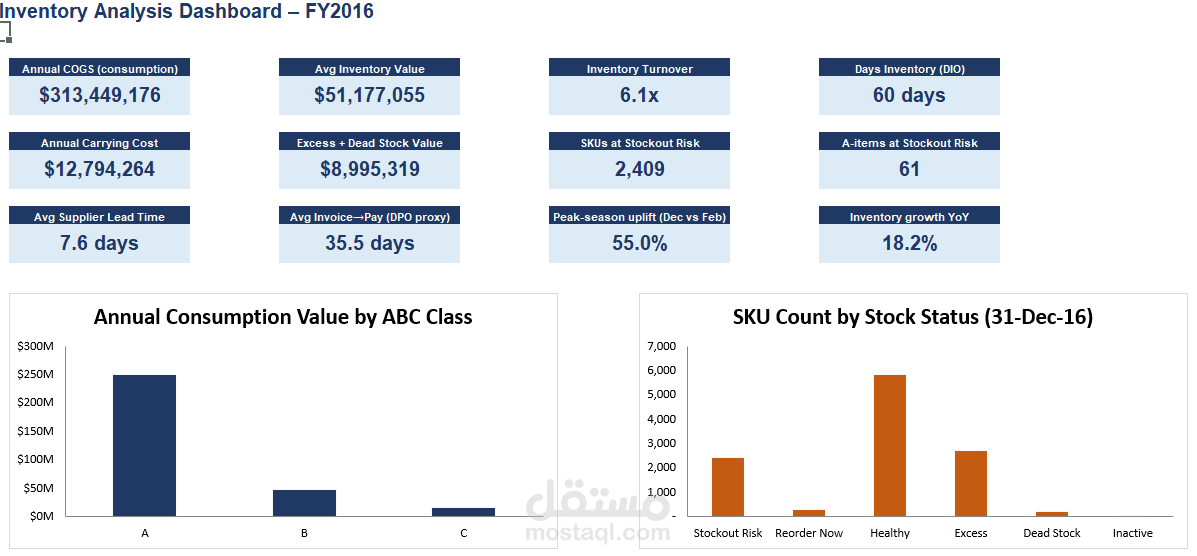
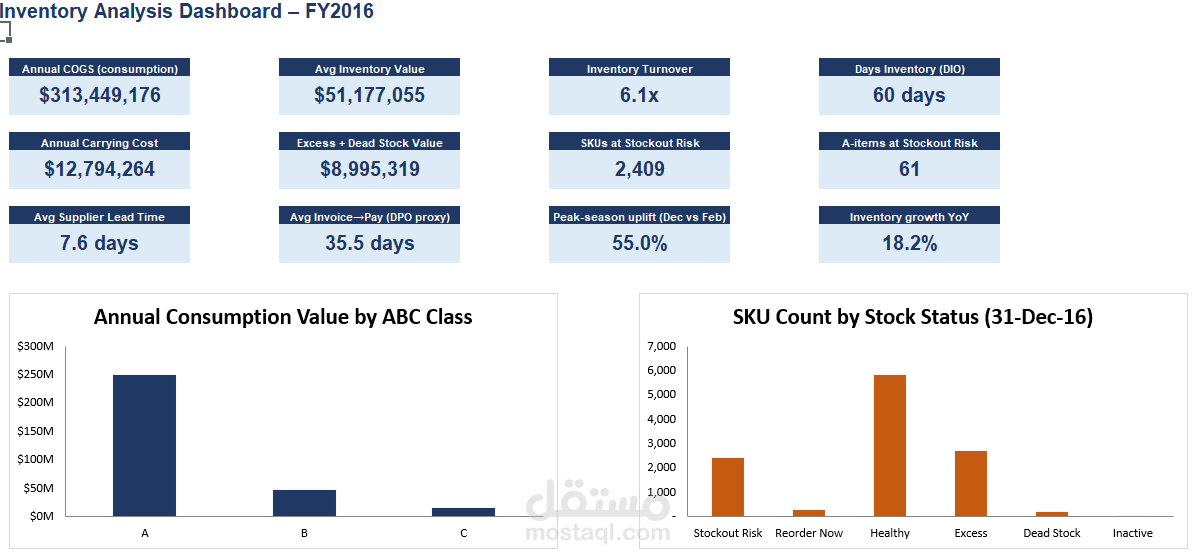
Description This is an end-to-end inventory analysis for a multi-store beverage distributor with 80 stores and 11.5K SKUs. I cleaned more than 2.4M purchase, sales and inventory records in Python. From them I built an interactive Excel model with 312K formulas and a KPI dashboard to support inventory decisions.
Goals
Set optimal inventory levels and reorder policies for each SKU.
Reduce stockouts and excess stock.
Improve inventory turnover and free up working capital.
Find inefficiencies in procurement and supplier management.
Build a sustainable inventory strategy.
Needs
A reliable demand baseline, because the sales data was cut off at Excel's row limit.
A clear way to rank SKUs by value and by how predictable their demand is (ABC-XYZ).
EOQ, safety stock and reorder-point calculations for each SKU.
Visibility into lead-time variability and vendor performance.
A dashboard that managers can update themselves.
Insights
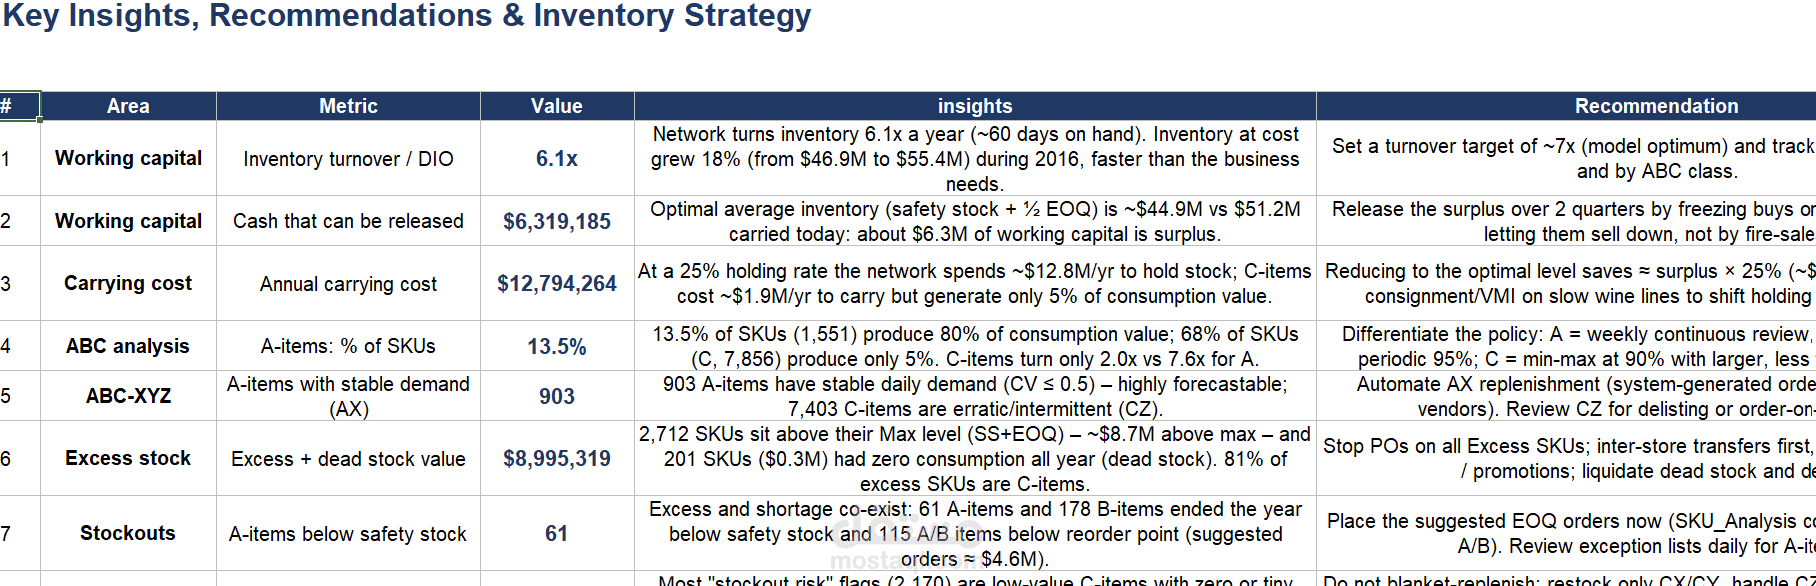
The main problem is stock in the wrong places, not too much stock overall. There is $8.7M of excess stock, mostly in slow C-items, while 61 high-value A-items are below safety stock.
Just 13.5% of SKUs generate 80% of value. C-items turn only 2x a year, compared with 7.6x for A-items.
Optimizing stock levels frees $6.3M in working capital, raises turnover from 6.1x to about 7x, and saves around $1.6M a year in carrying costs.
Half of all POs are under $5K yet make up only 1.2% of spend. Consolidating them would cut admin effort.
One person approves every invoice over $250K, which is a key-person risk.
Demand is strongly seasonal. December runs 55% above February, and Friday and Saturday sales are 1.6× an average day.