LEGO Set Explorer : Maven analytics guided project
تفاصيل العمل
LEGO Set Explorer
Project goals
The goal was to turn a raw, messy catalogue of LEGO sets into a clean, interactive report where anyone can explore the product range without writing a query. The work followed three objectives:
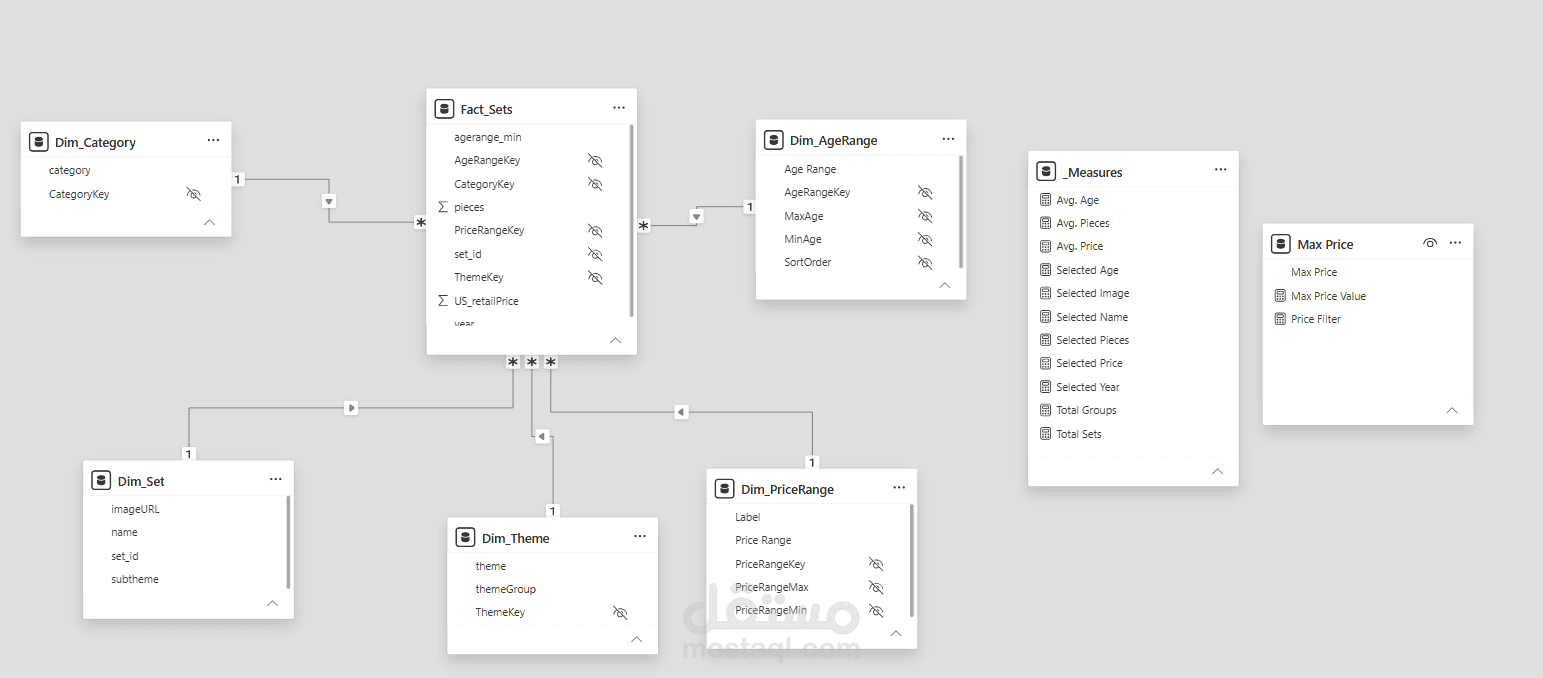
load the Brickset export, remove fields that don't help the analysis, fix data types, and keep only complete records (price, age, pieces and image). That cut 18,457 rows down to 4,385 usable sets, priced from $1.99 to $849.99.
build a layout with headline KPIs, slicers, a detailed set table and a single-set detail panel, with cross-filtering set up so each visual reacts only where it should.
Max Price parameter, image tooltips, a reset bookmark and a second page with a decomposition tree.
Business needs
The report is built for people who make decisions about a product portfolio, such as a retailer planning its shelf mix, a product manager comparing themes, or a buyer checking price positioning. They need to answer questions like:
Which themes and age groups make up the catalogue, and how big is each?
How does price relate to set size and to the target age?
Which sets fit a given budget for a given audience?
What does a specific set look like, and what are its key specs?
Discovering insights
Checking null counts and data types early showed that about 60% of records had no US price. That shaped what the analysis could honestly claim: it covers priced US releases, not the full LEGO catalogue.
Grouping continuous values into Age Range and Price Range buckets made patterns visible that raw numbers hide. For example, 76% of sets target ages 5 to 9, and only 9 sets cost more than $500.
Average price alone misleads, because bigger sets cost more. Price per piece shows the real pattern. Adult sets average about $197 against $34 for ages 5 to 9, yet they cost less per piece (median about $0.09 against $0.58 for ages 1 to 4, where the bricks are much larger).
The average set price roughly doubled from about $36 in 2018 to about $73 in 2022. That points to a clear shift toward larger, premium sets.
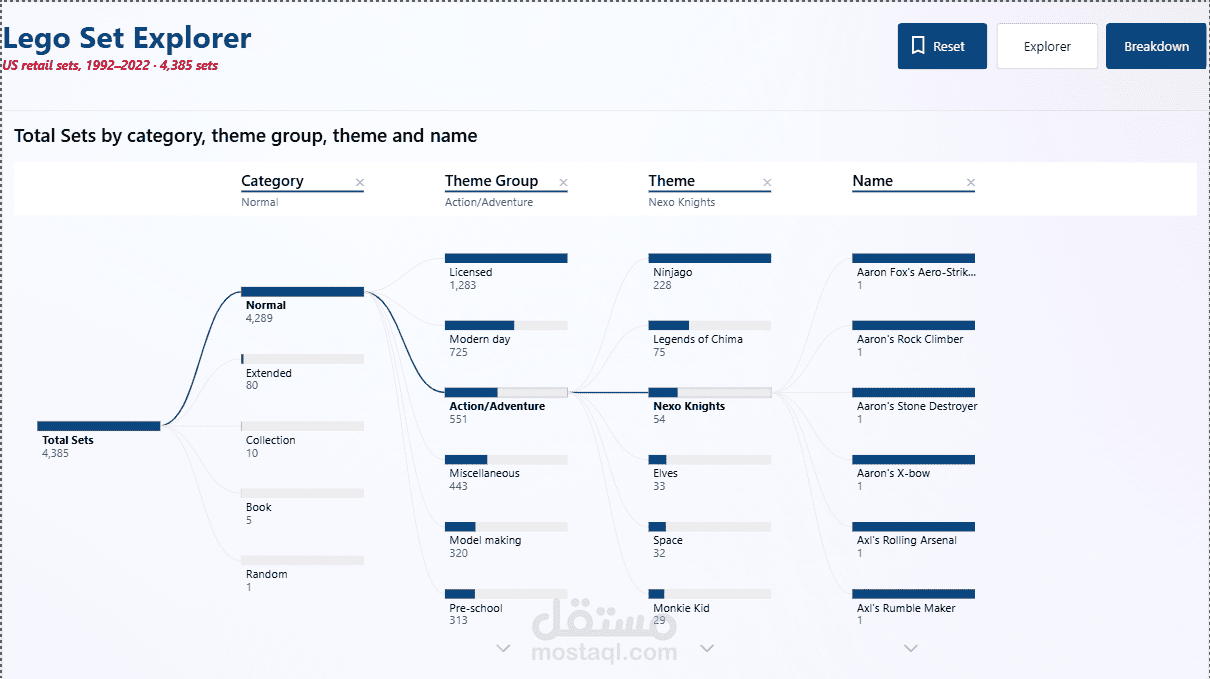
The decomposition tree lets users follow a question from category to theme group to theme to individual set. It shows, for example, that Licensed is the largest group with 1,288 sets, led by Star Wars, while Technical and Model Making have much higher average prices.
Presenting the insights
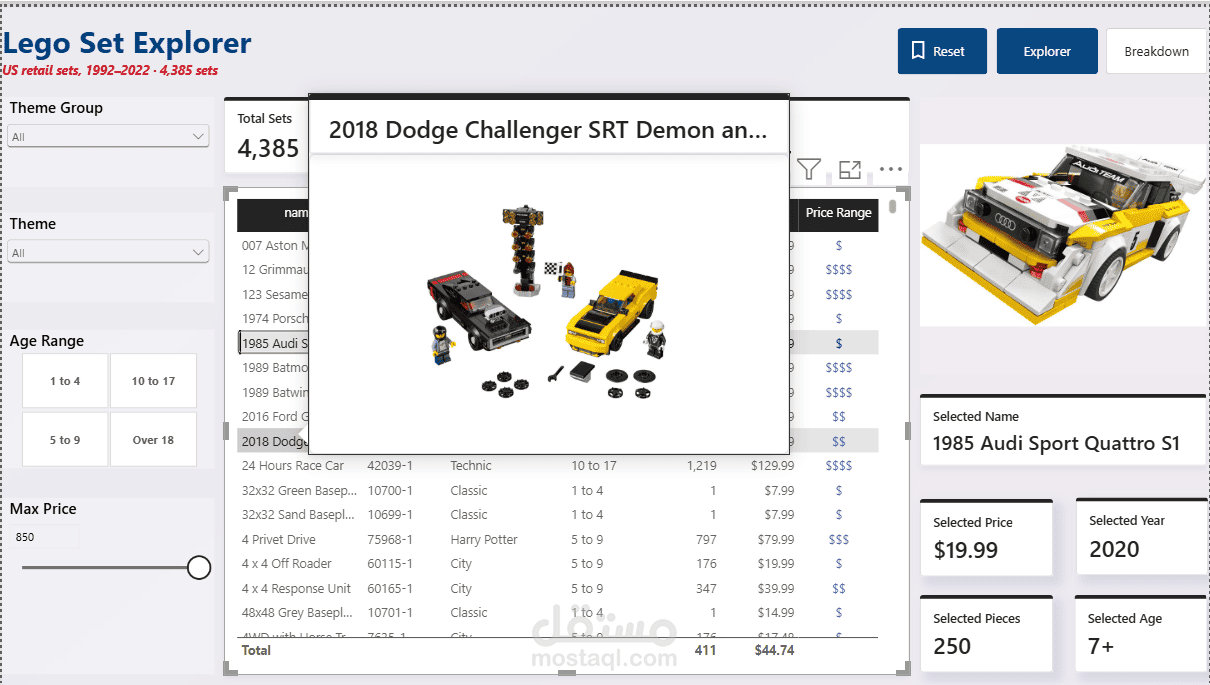
KPI cards at the top give the answer at a glance. They respond to slicers but not to row selections, so the context stays stable while the user explores.
Slicers and the price parameter on the left let users define their own question, such as "Disney sets for ages 5 to 9 under $50".
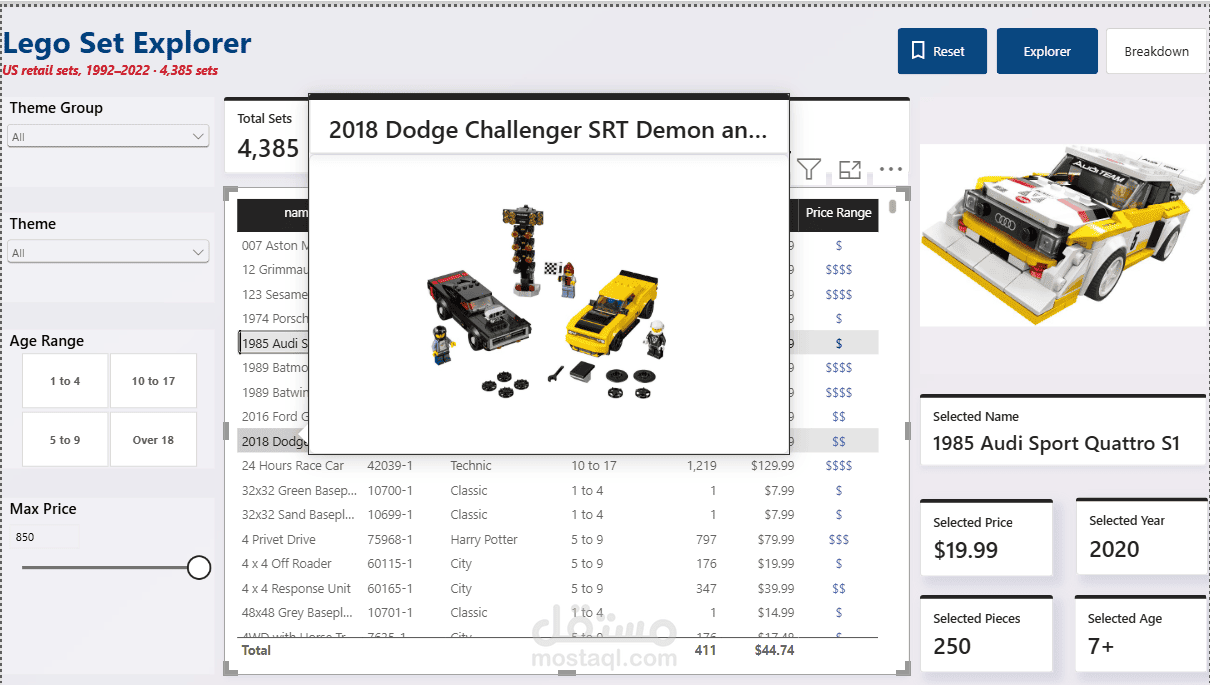
The table in the center gives the full detail, and hovering over a row shows the set's image.
The detail panel turns a single row into a readable profile, and shows placeholders when several sets are selected.
The reset button and page navigation keep the report easy to use for people who aren't Power BI experts.