Excel Report
تفاصيل العمل
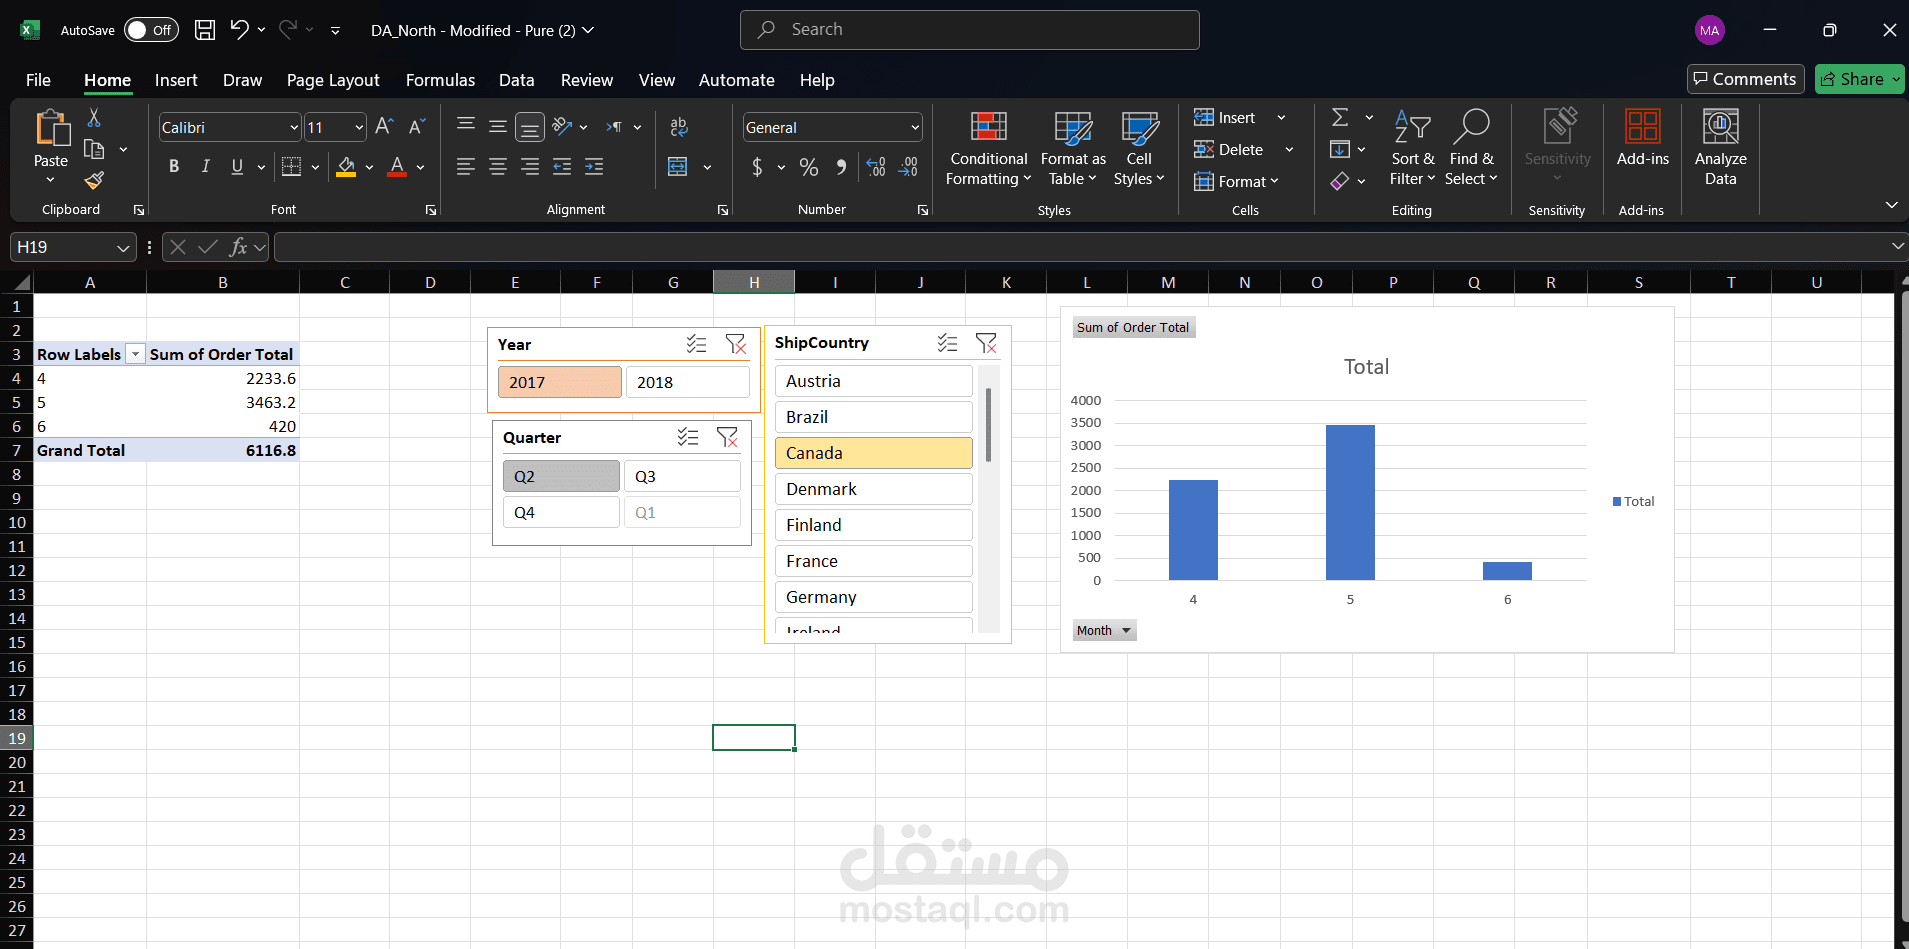
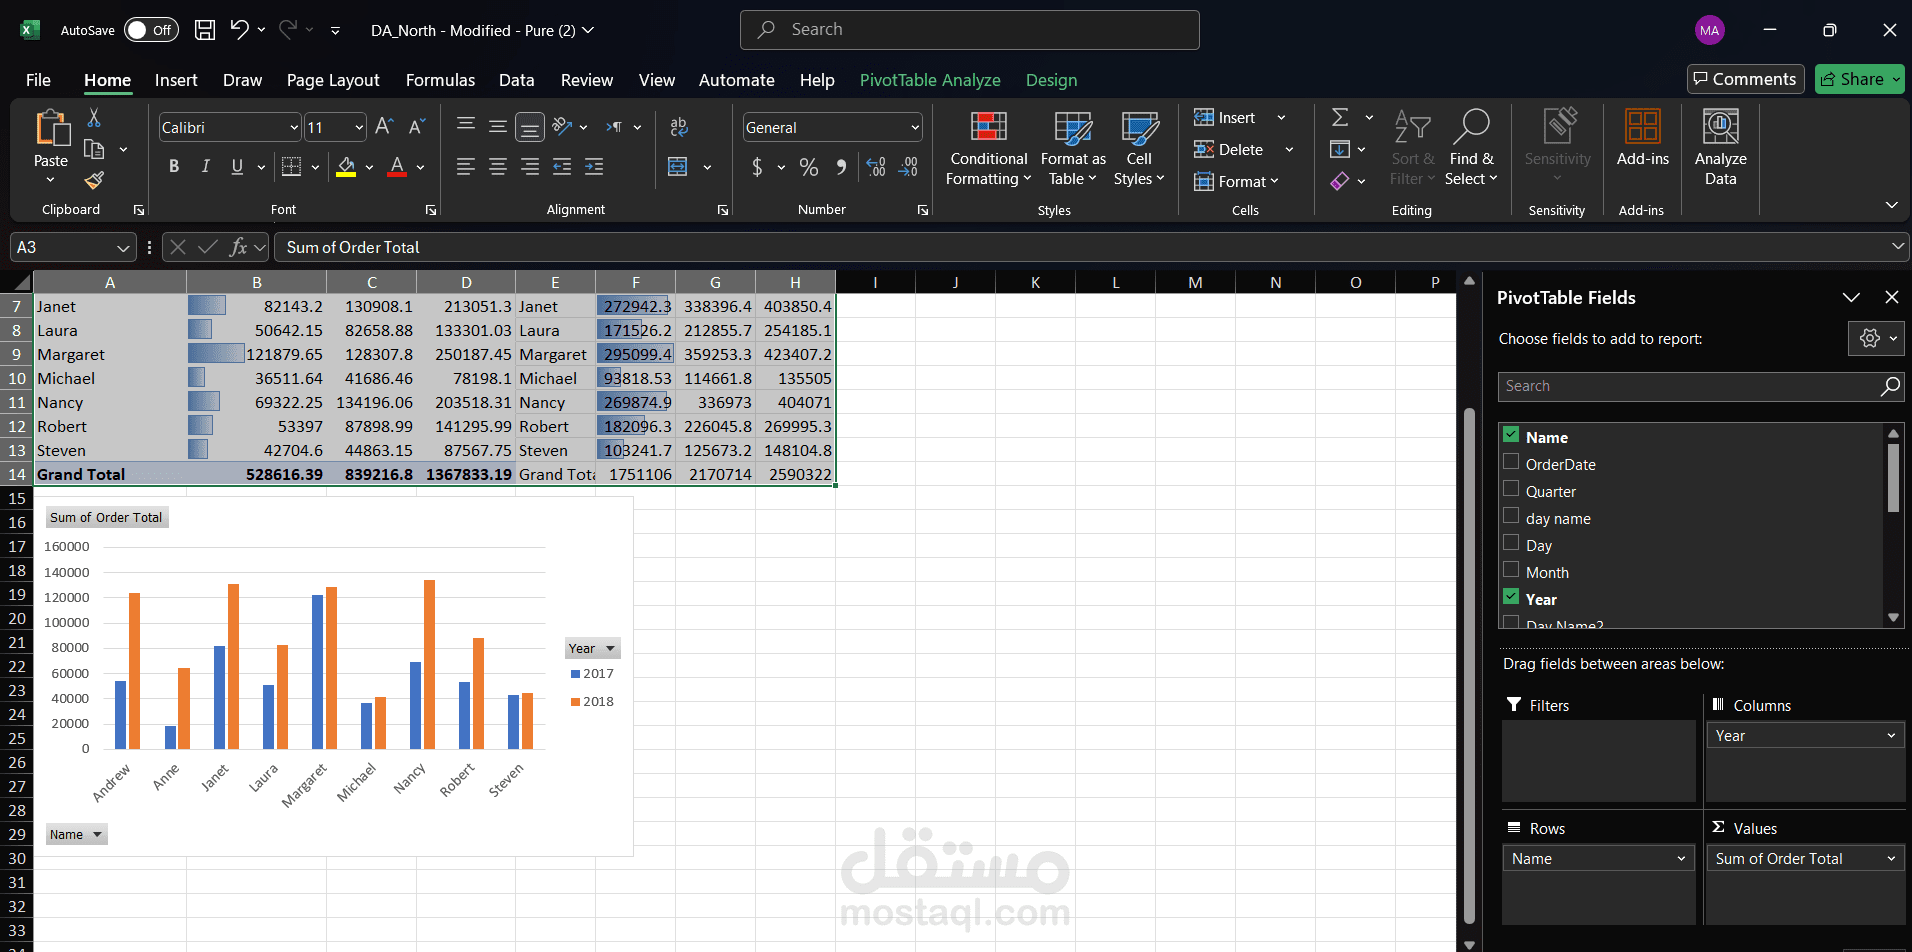
This Excel dashboard uses PivotTables and PivotCharts to analyze sales performance by employee across different years. It summarizes order totals, compares year-over-year sales (2017 vs. 2018), and highlights top contributors. The visualization helps identify trends in employee performance and supports decision-making with clear data segmentation.