Power BI dashboard
تفاصيل العمل
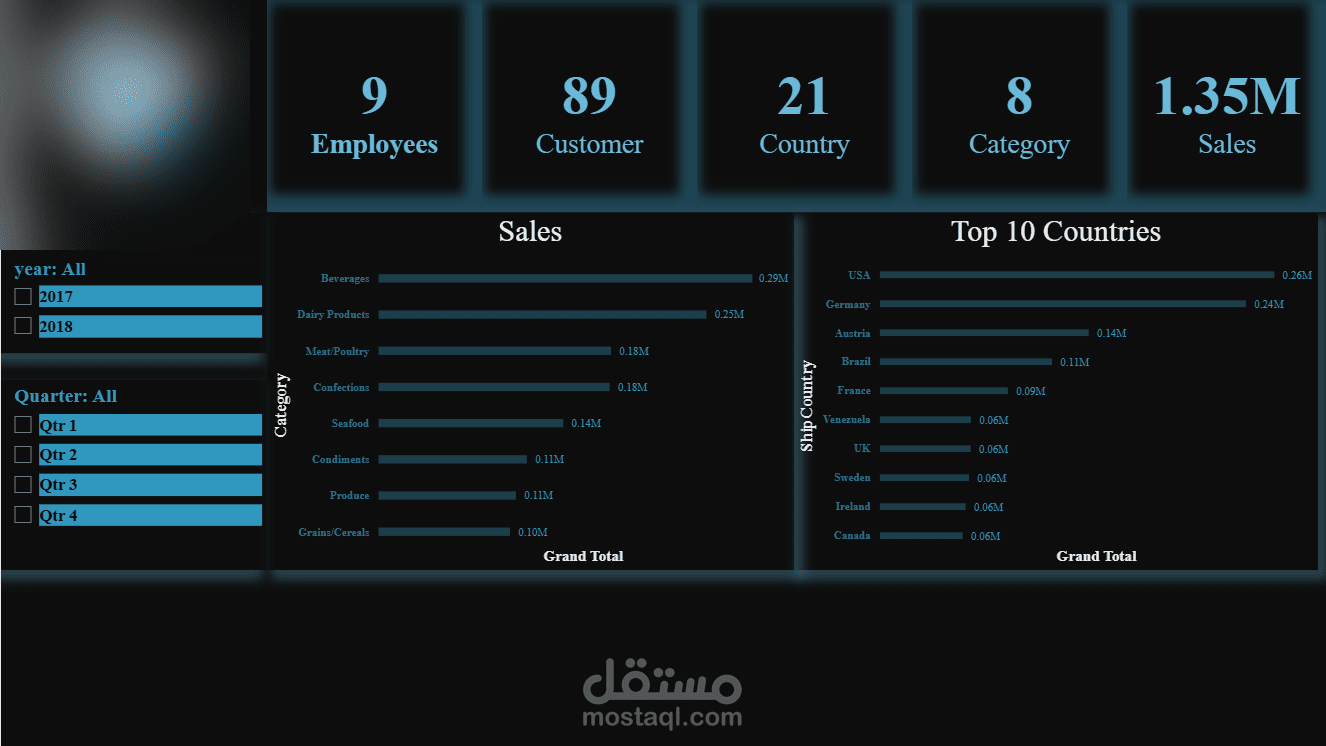
This Power BI dashboard presents customer and financial insights through interactive visualizations. It includes key metrics such as total balance, average age, and customer distribution, with breakdowns by region, gender, and quarter. The layout combines charts, KPIs, and filters to allow users to explore trends and make data-driven decisions.