Supermarket Sales
تفاصيل العمل
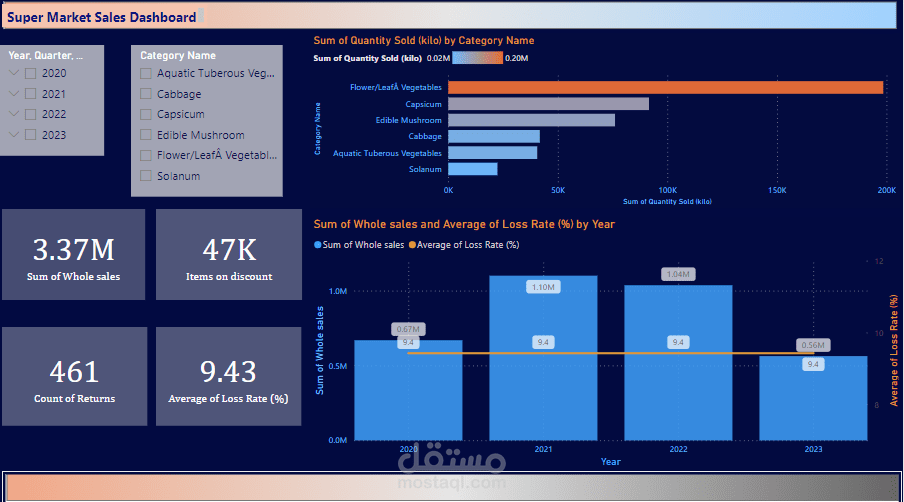
Supermarket Sales Report using Power Bi
The first page contains visuals that illustrate the changing of whole sales over years , The Quantity sold by categories , Total sales , Number of Items on Discount, Quantity of returns, and Average loss rate.
Also used Slicers for Time in details (year, quarter, month , and days), and Categories.