Designing Dashboard for a project
تفاصيل العمل

Creating an automated dashboard in Power BI involved several steps, from importing data to designing visualizations and ensuring automated data refresh. Here's a brief overview of the key steps:
1. Data Import:
- Connected Power BI to data source. Used Power Query Editor to transform and clean the data as needed.
2. Data Modeling:
- Defined the relationships between tables with multiple data tables. Created calculated columns or measures to derive additional insights from the data.
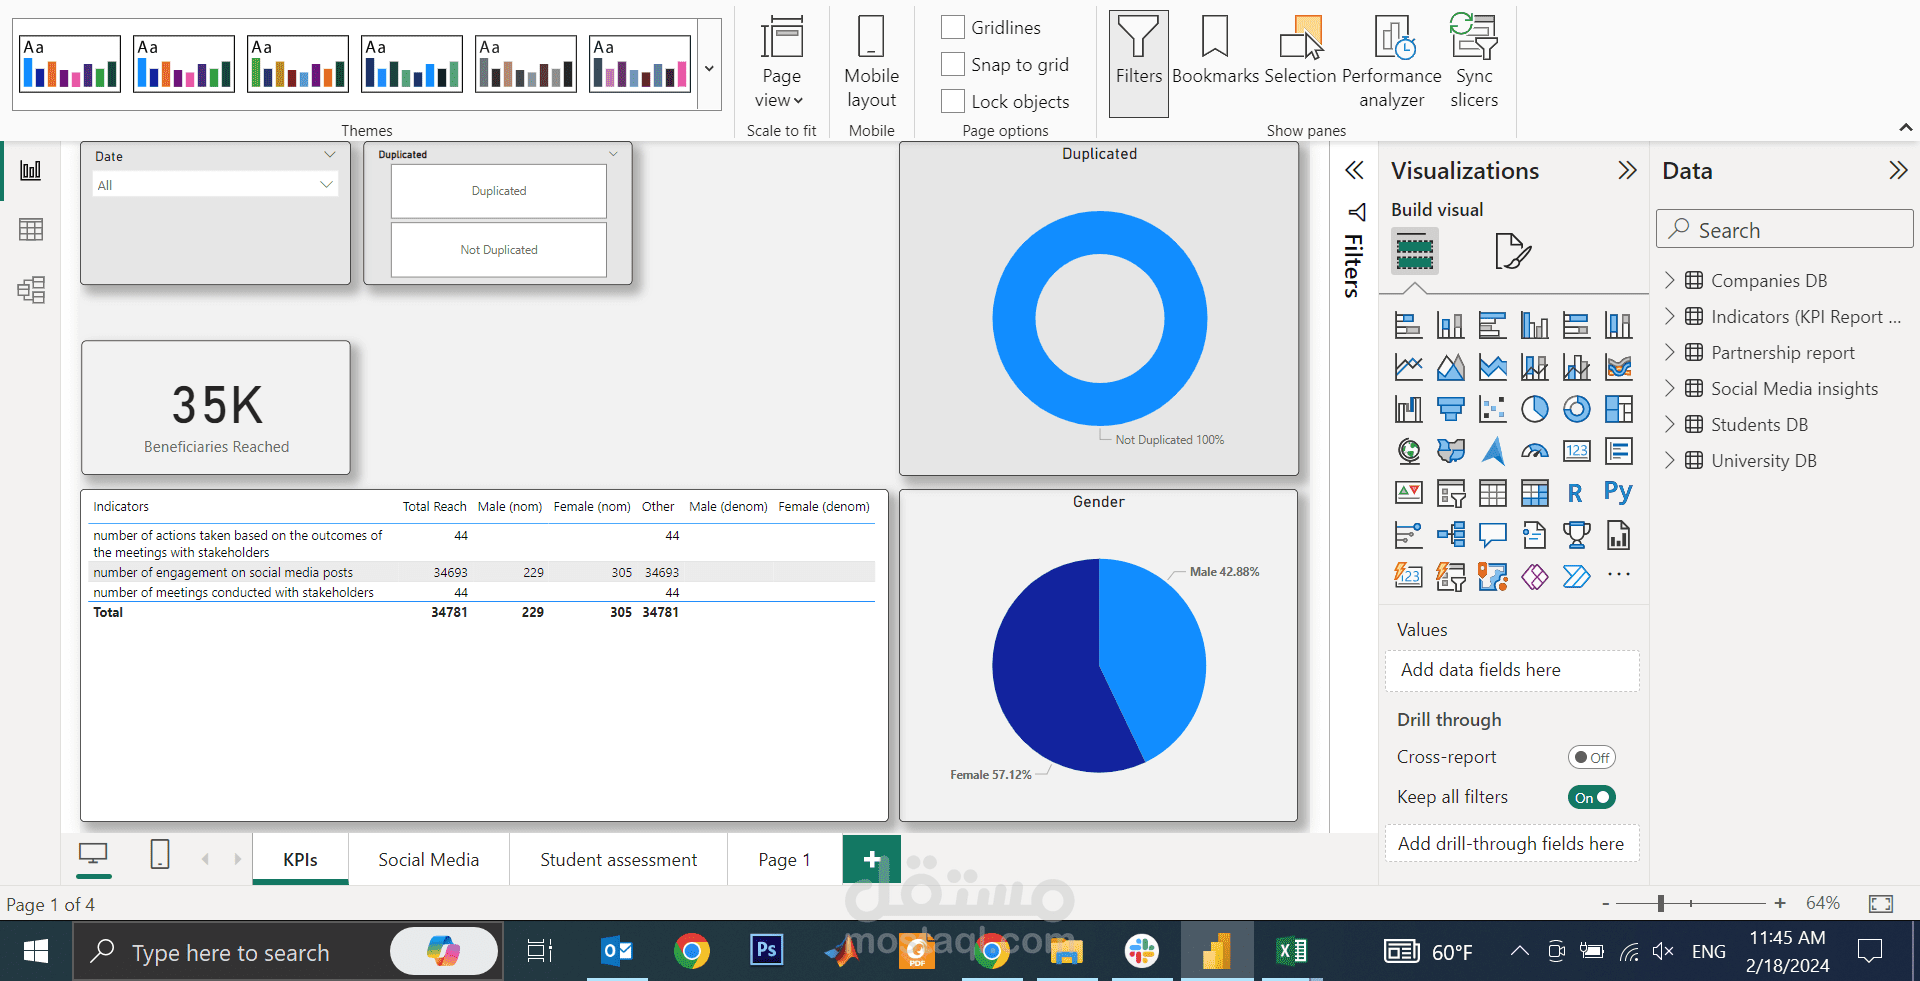
3. Data Visualization:
- created visualizations such as charts, tables, and more. to utilize the wide range of visualization options available in Power BI to represent the data effectively.
4. Dashboard Design:
- Organized visualizations into a cohesive dashboard layout. Customized the appearance of the dashboard, including titles, colors, and fonts.
5. Interactivity:
- Enhanced interactivity by adding slicers, filters, and drill-through actions. Users can interact with the data dynamically to explore specific aspects of the information.
By these steps, dynamic and automated dashboard is created in Power BI that not only provides valuable insights but also allows users to interact with the data effortlessly.