Sales Dashboards examples
تفاصيل العمل
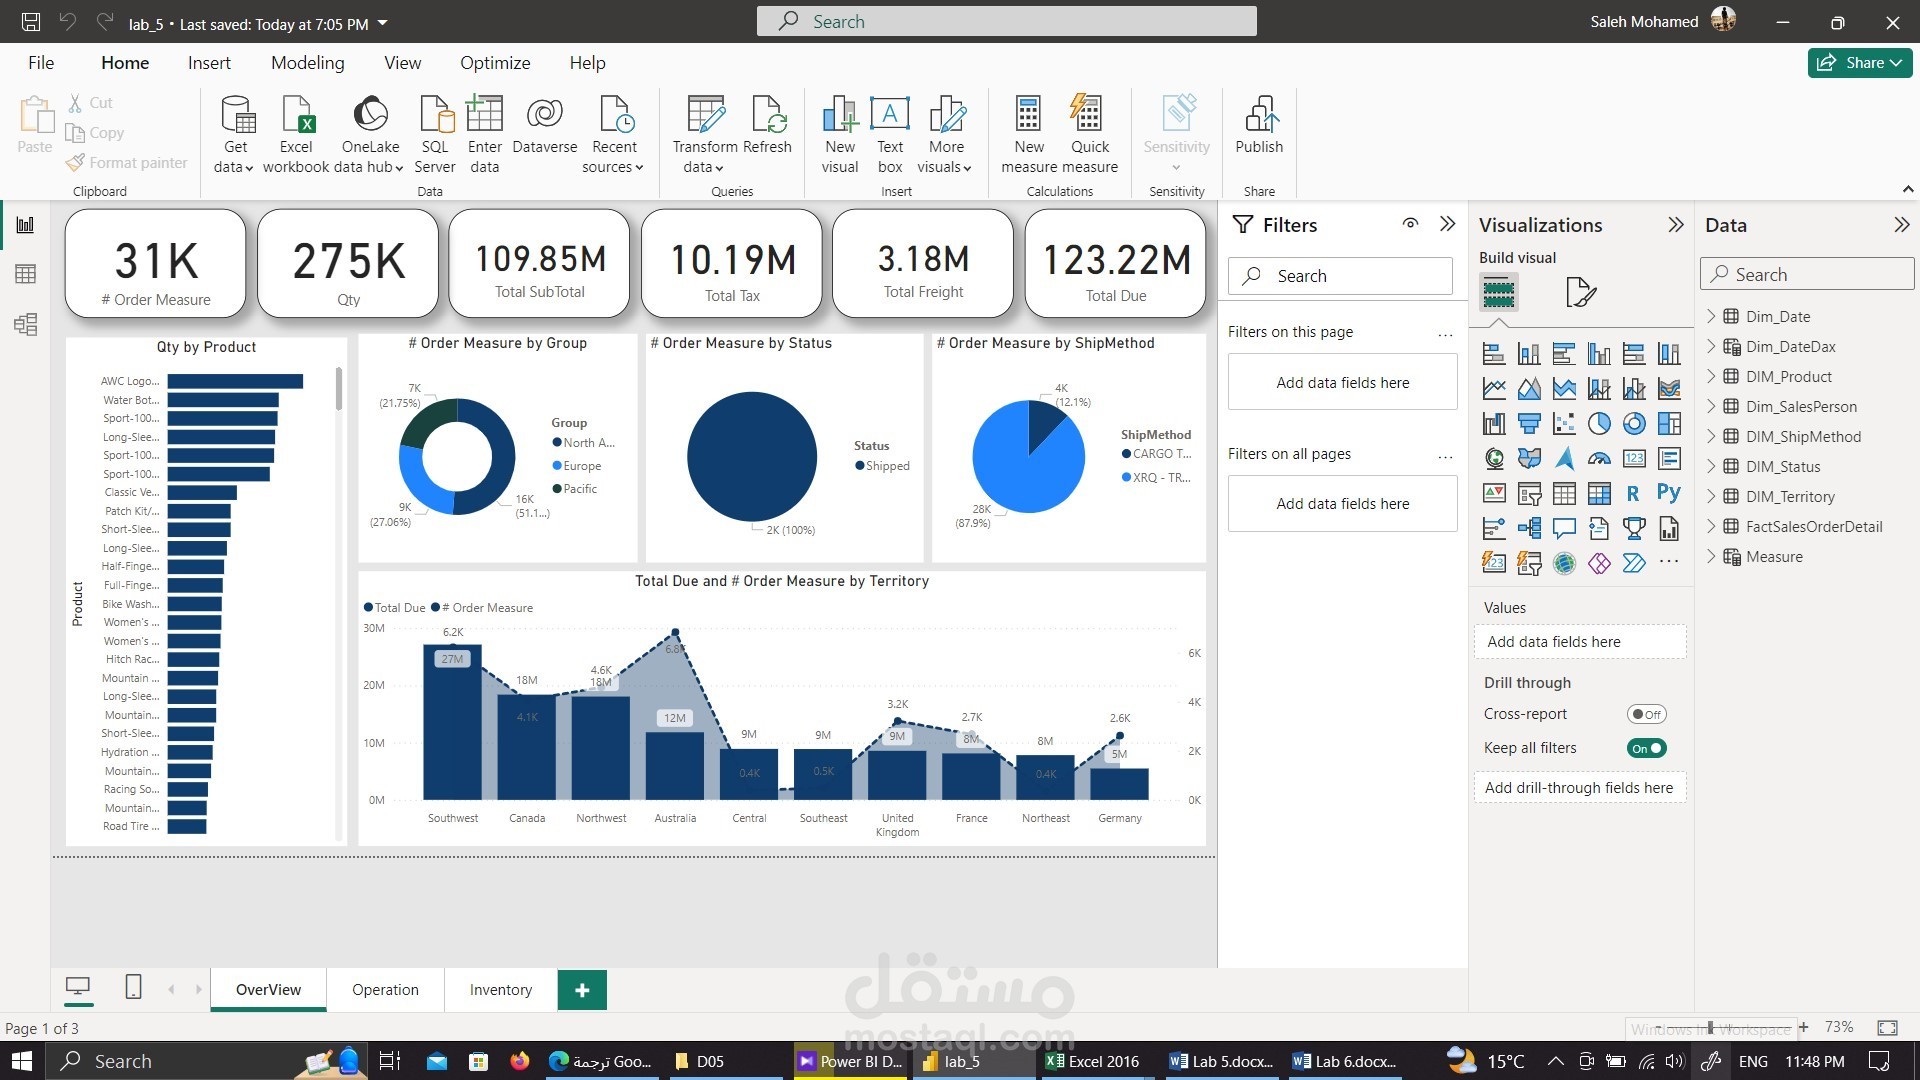
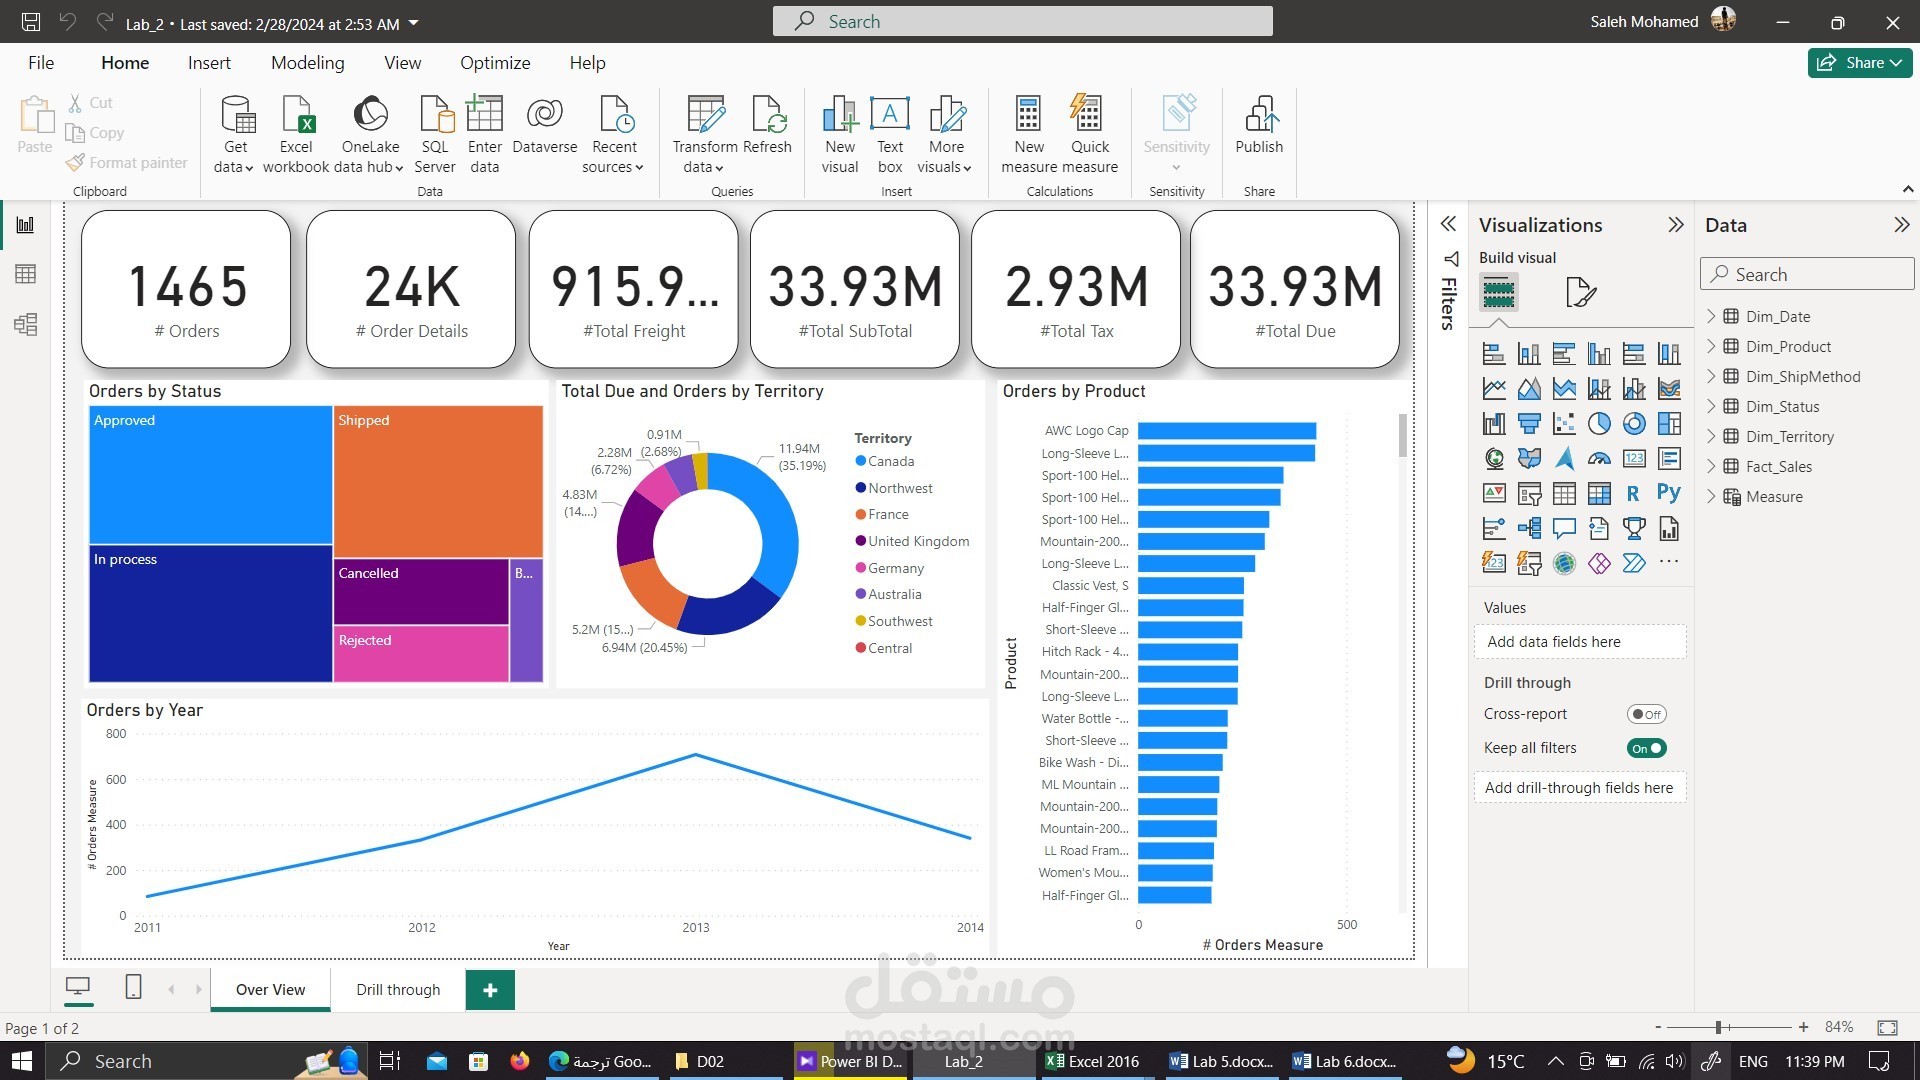
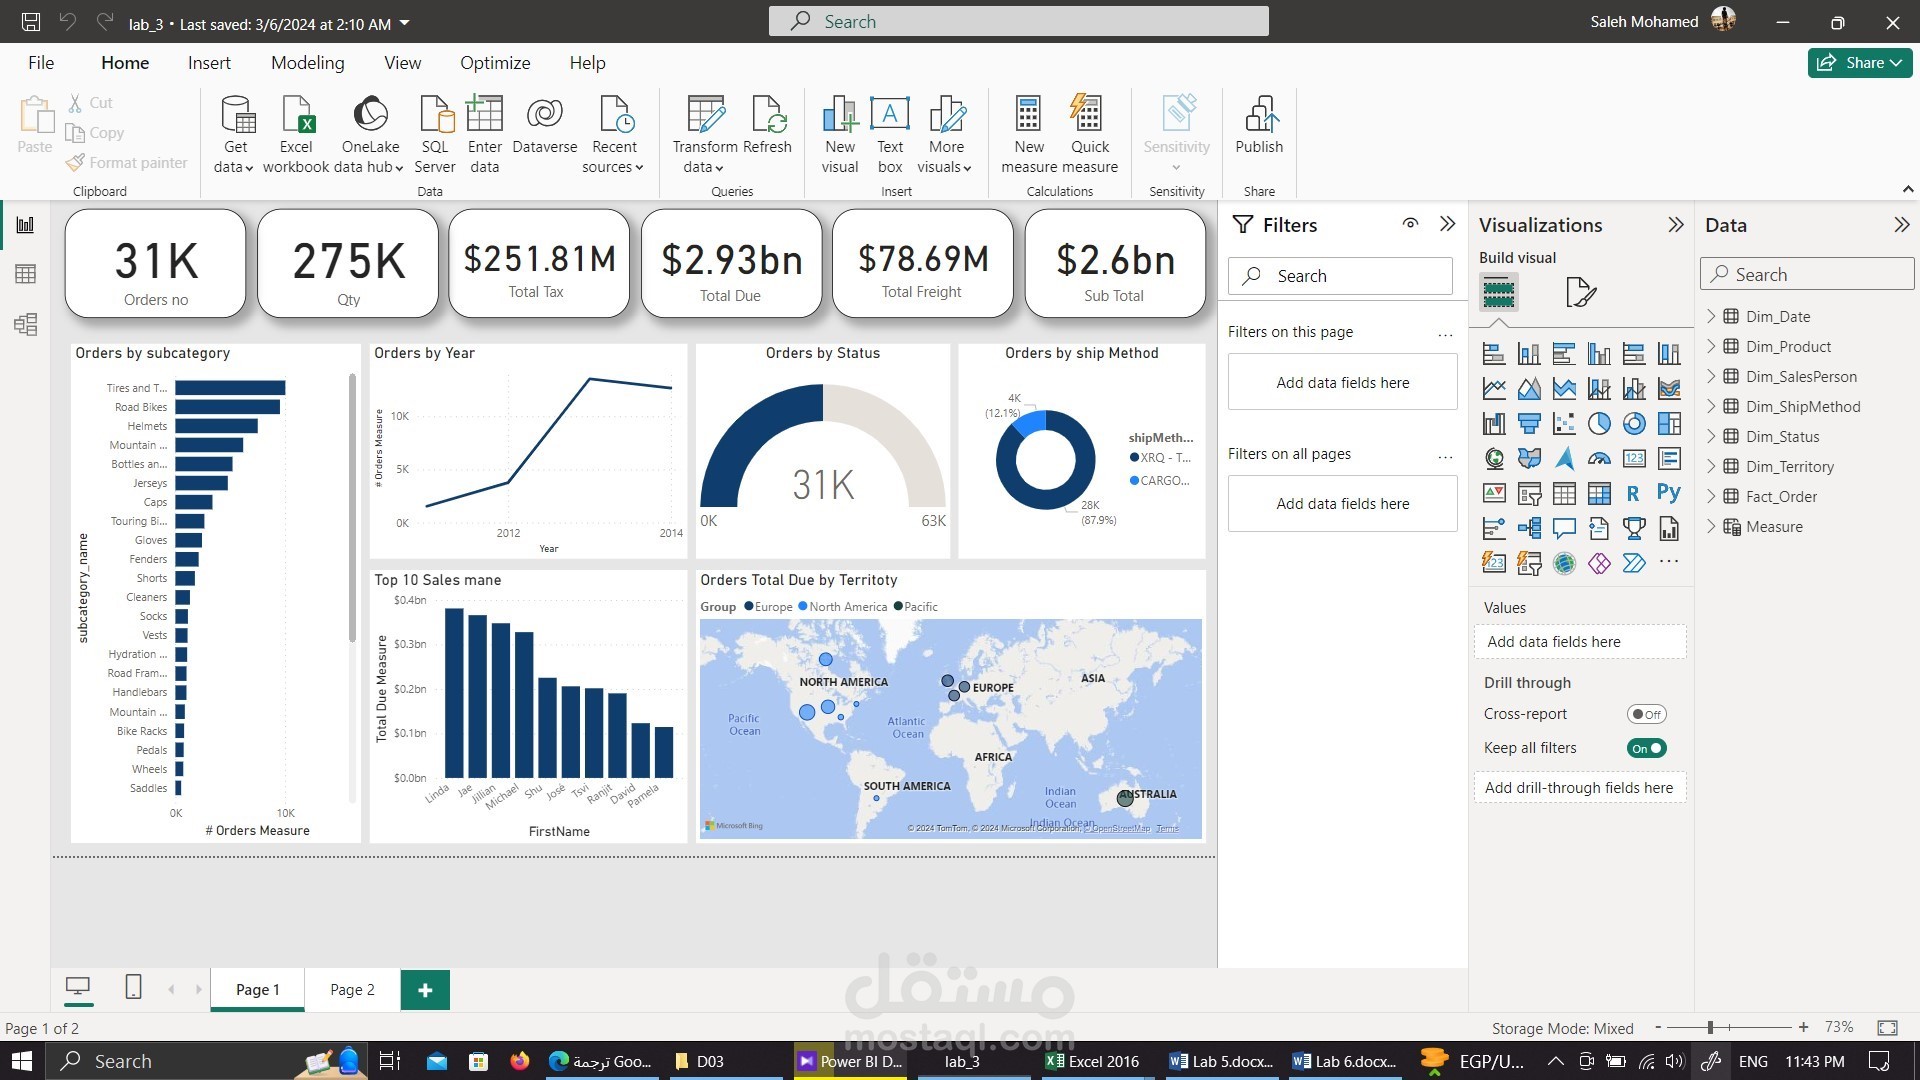
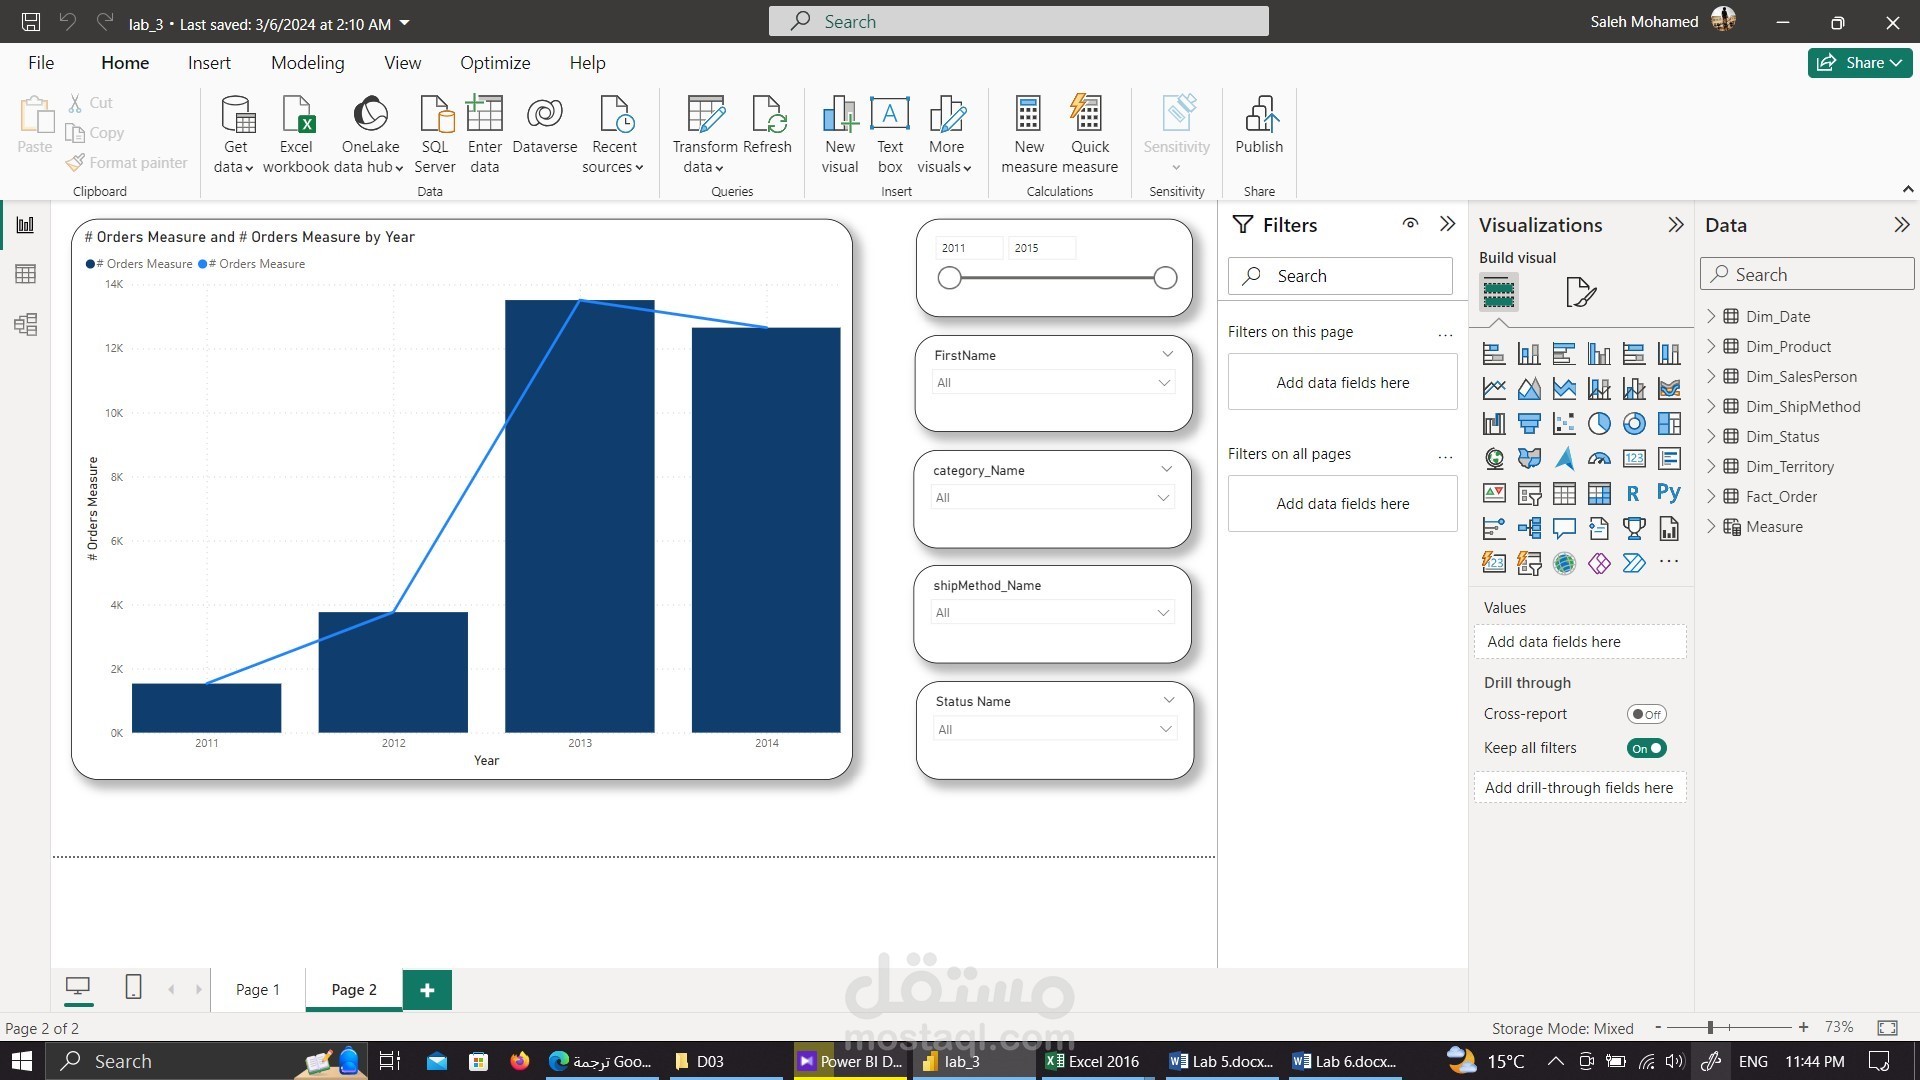
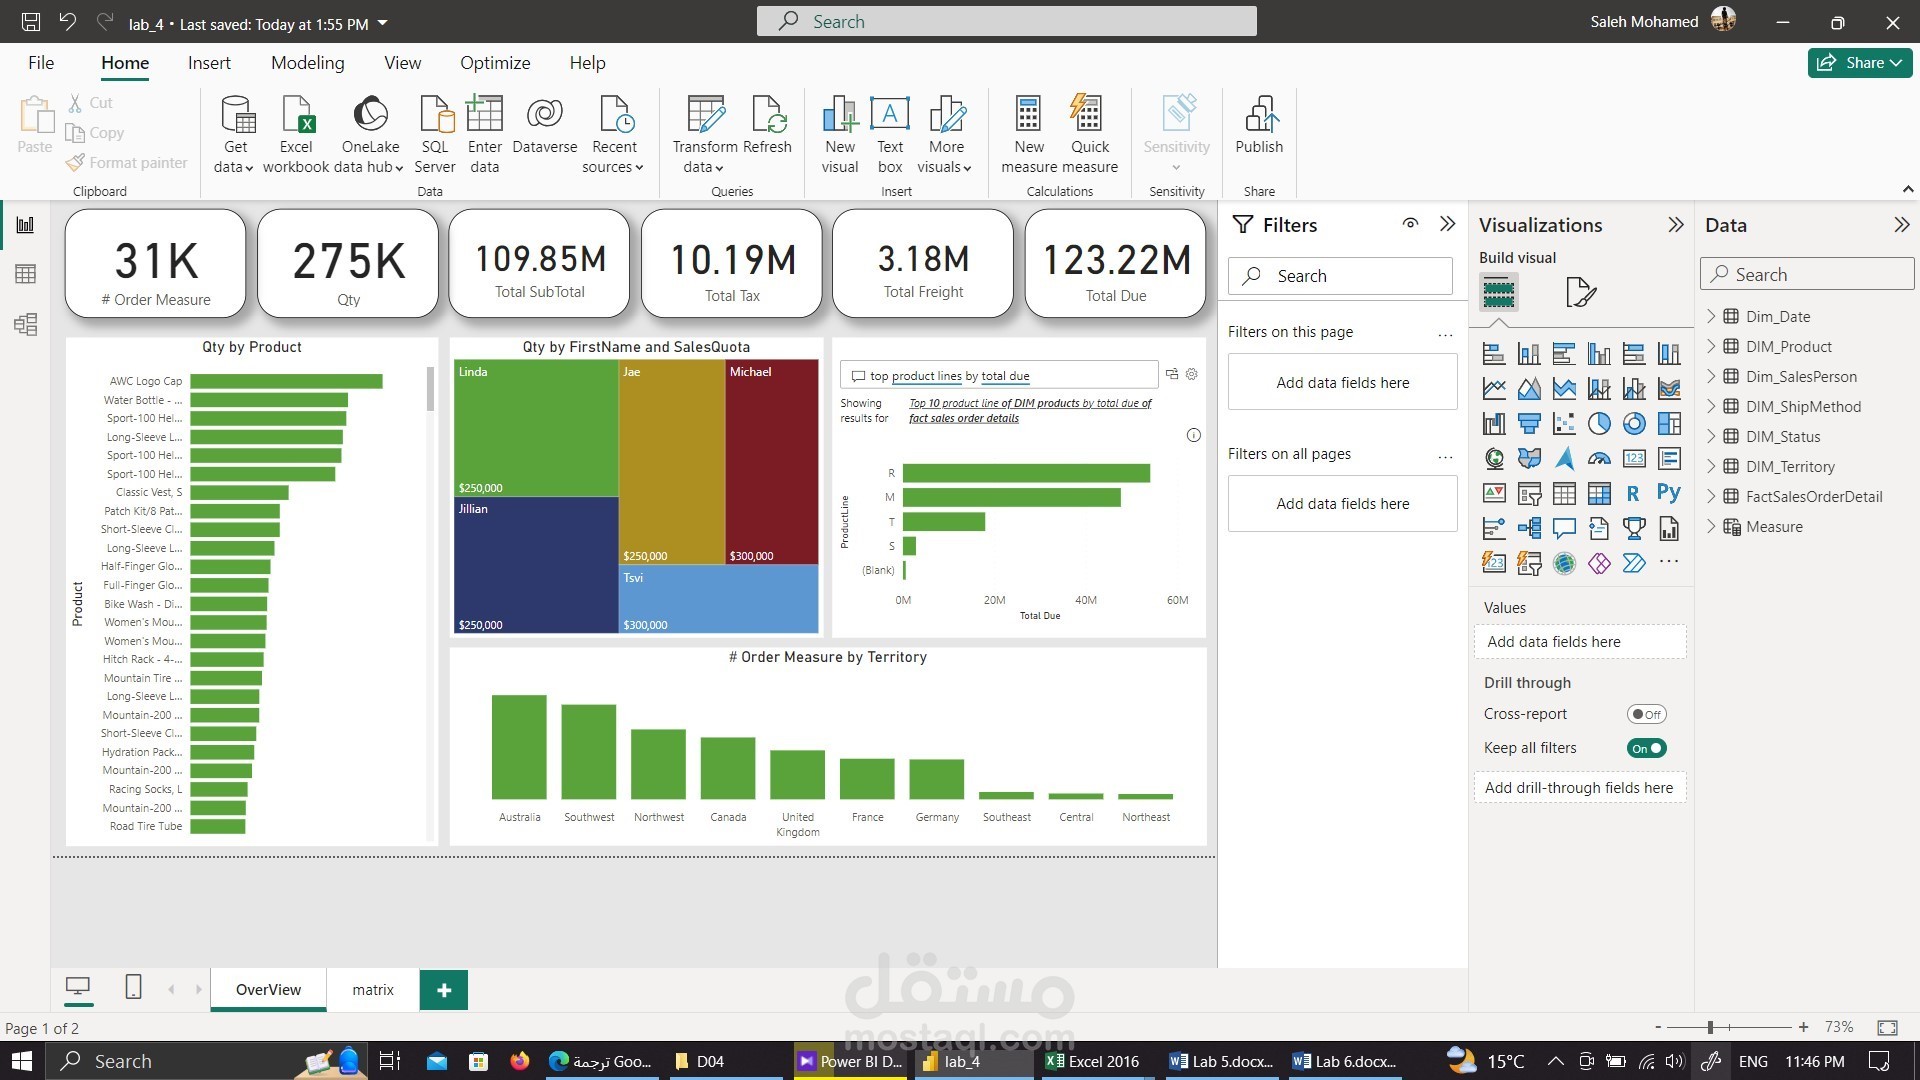

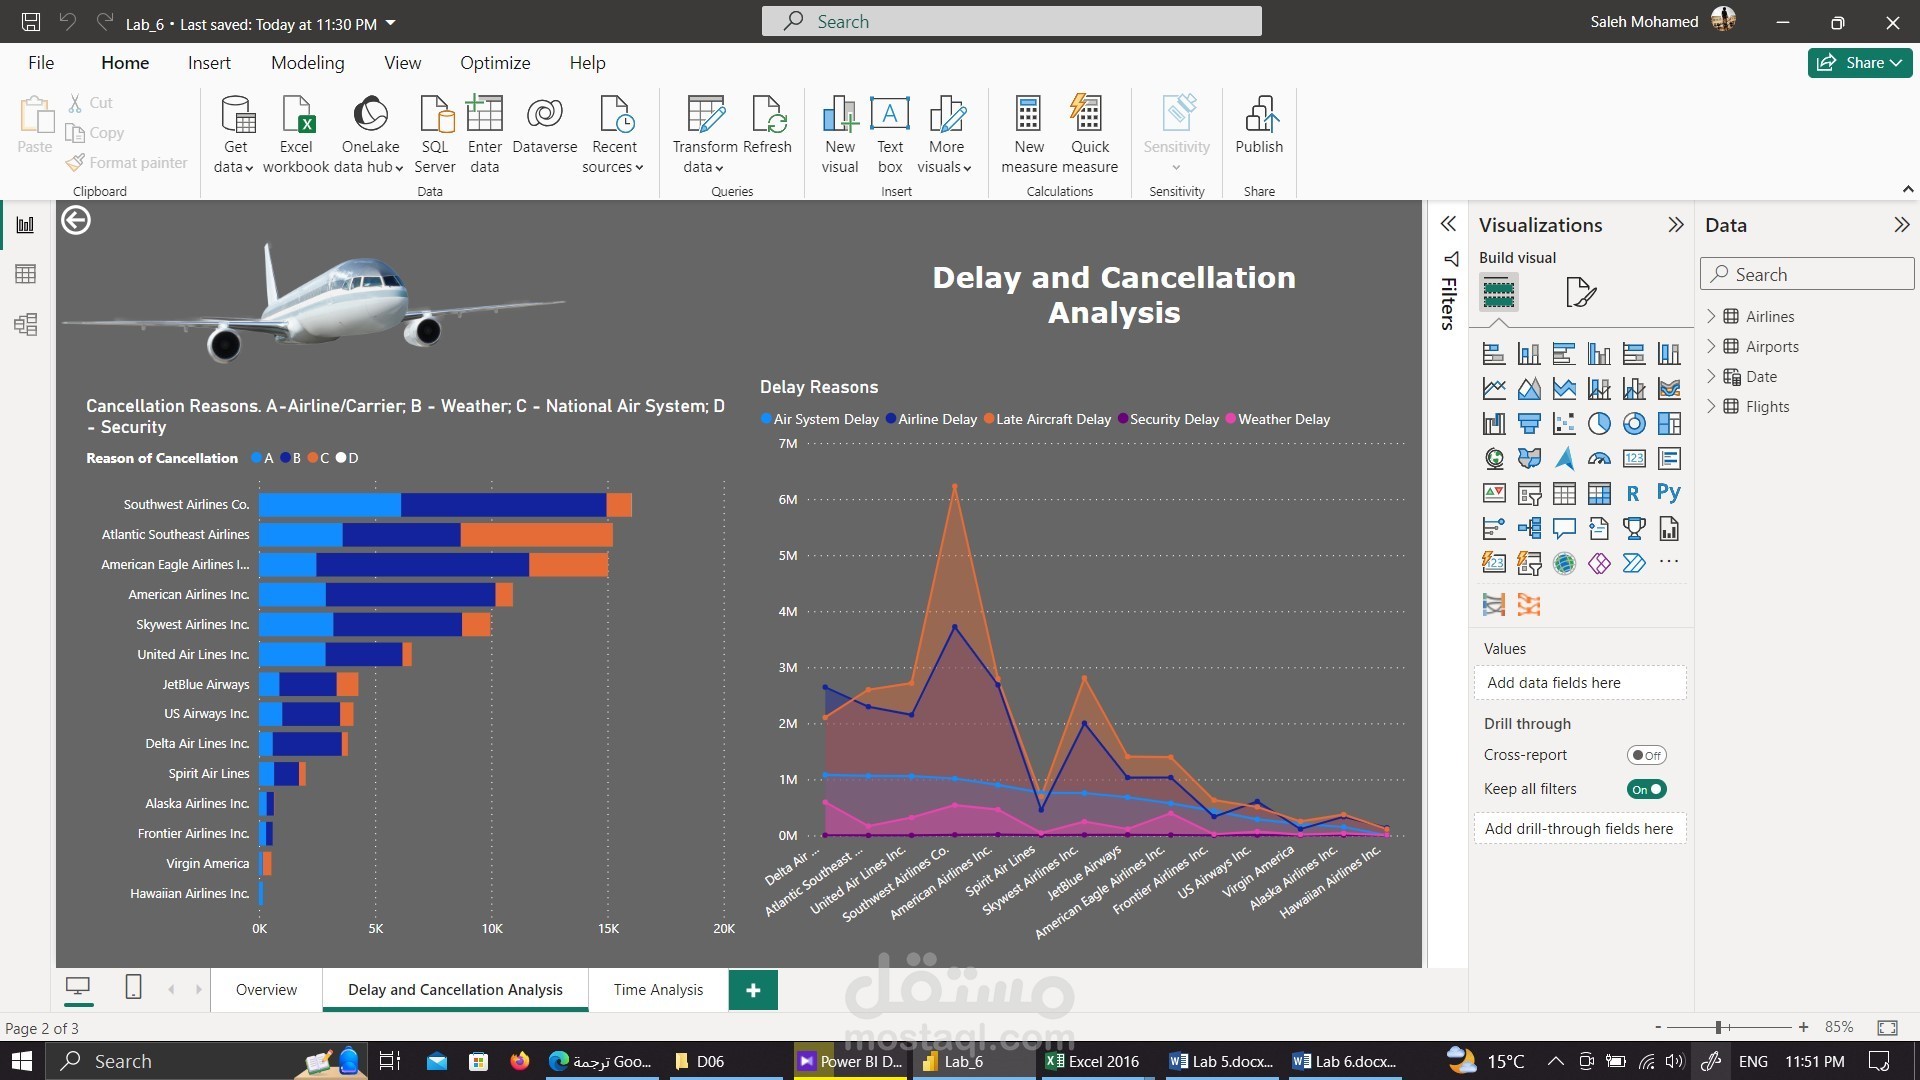
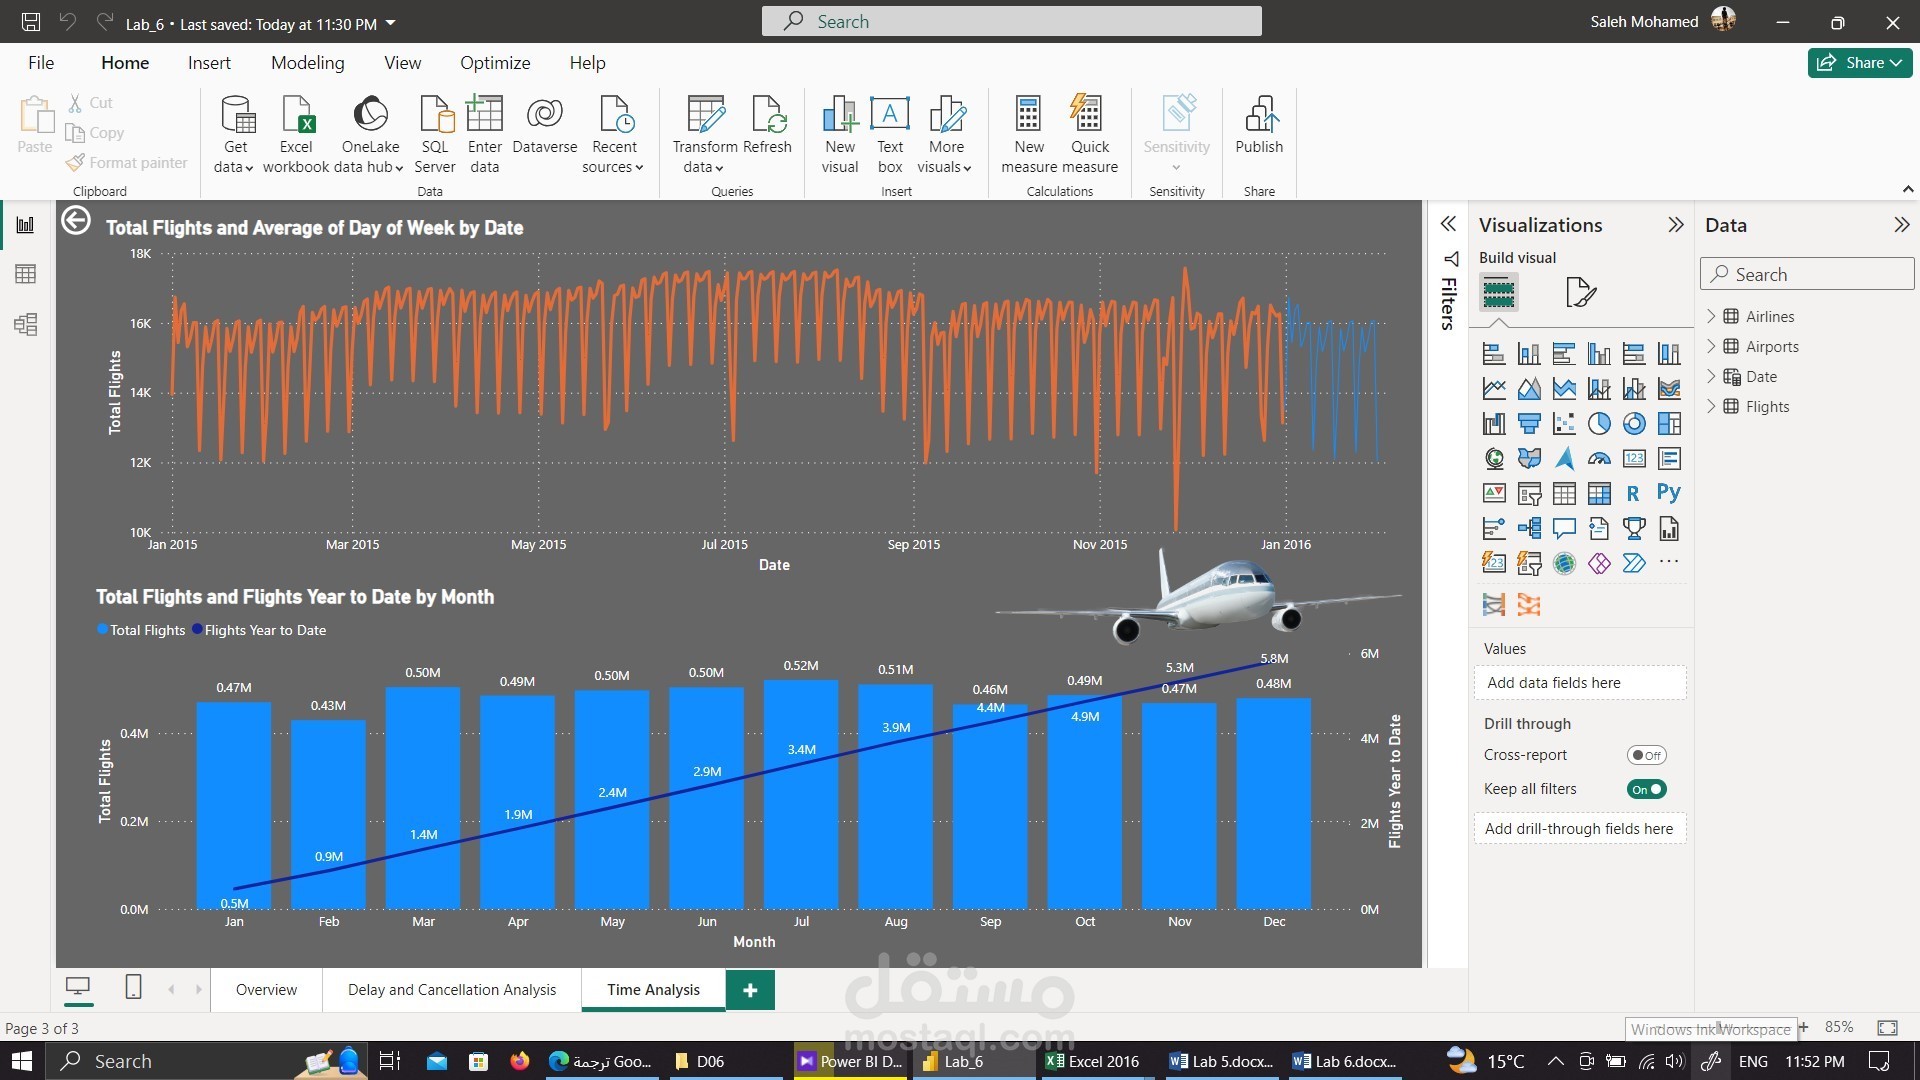
A sales dashboard is a visual representation of key sales metrics and performance indicators, providing a quick and easy way for sales teams, managers, and stakeholders to monitor and analyze sales data. Creating an effective sales dashboard involves selecting relevant metrics, visualizing the data, and updating the dashboard regularly. Here are some components and best practices for building a sales dashboard:
Key Performance Indicators (KPIs):
Choose KPIs that align with your sales goals and objectives. Common sales KPIs include:
Sales revenue
Sales growth
Conversion rates
Average deal size
Sales pipeline and stages
Win rates
Customer acquisition cost (CAC)
Customer lifetime value (CLV)
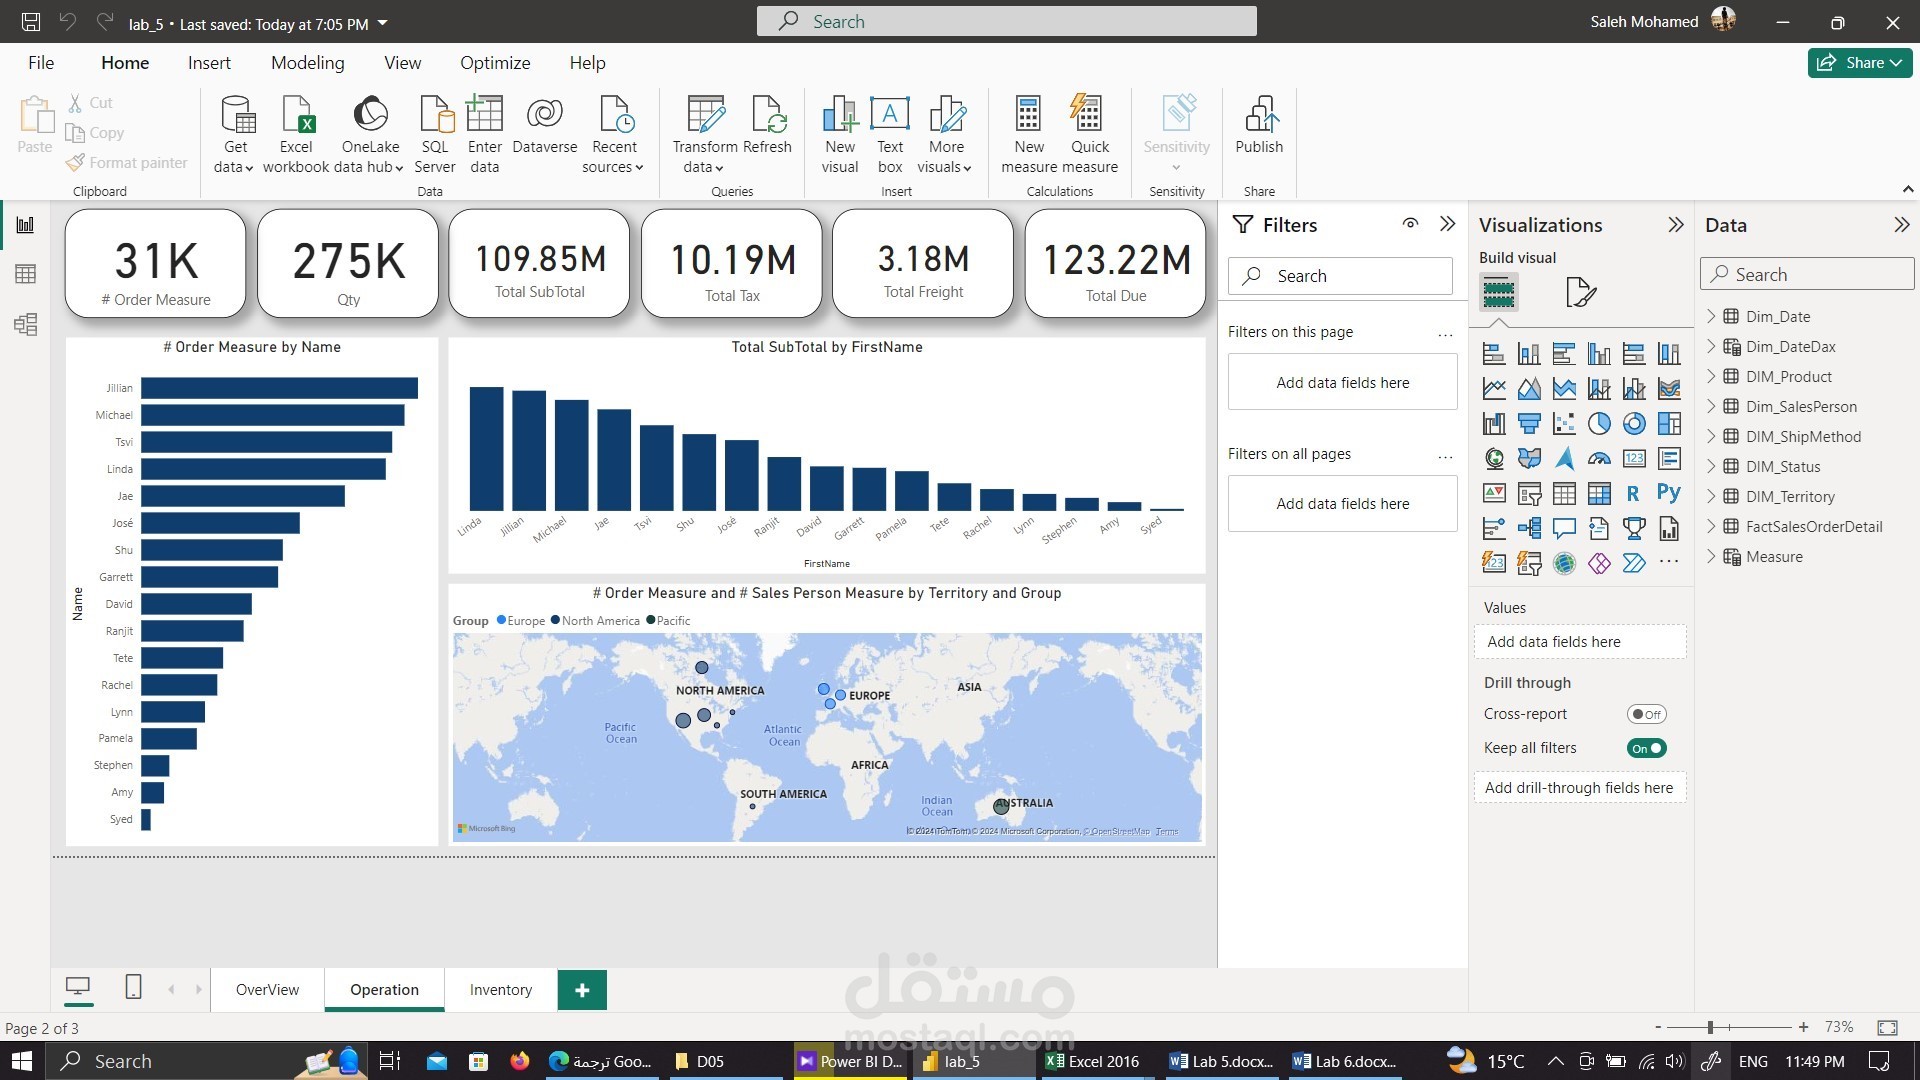
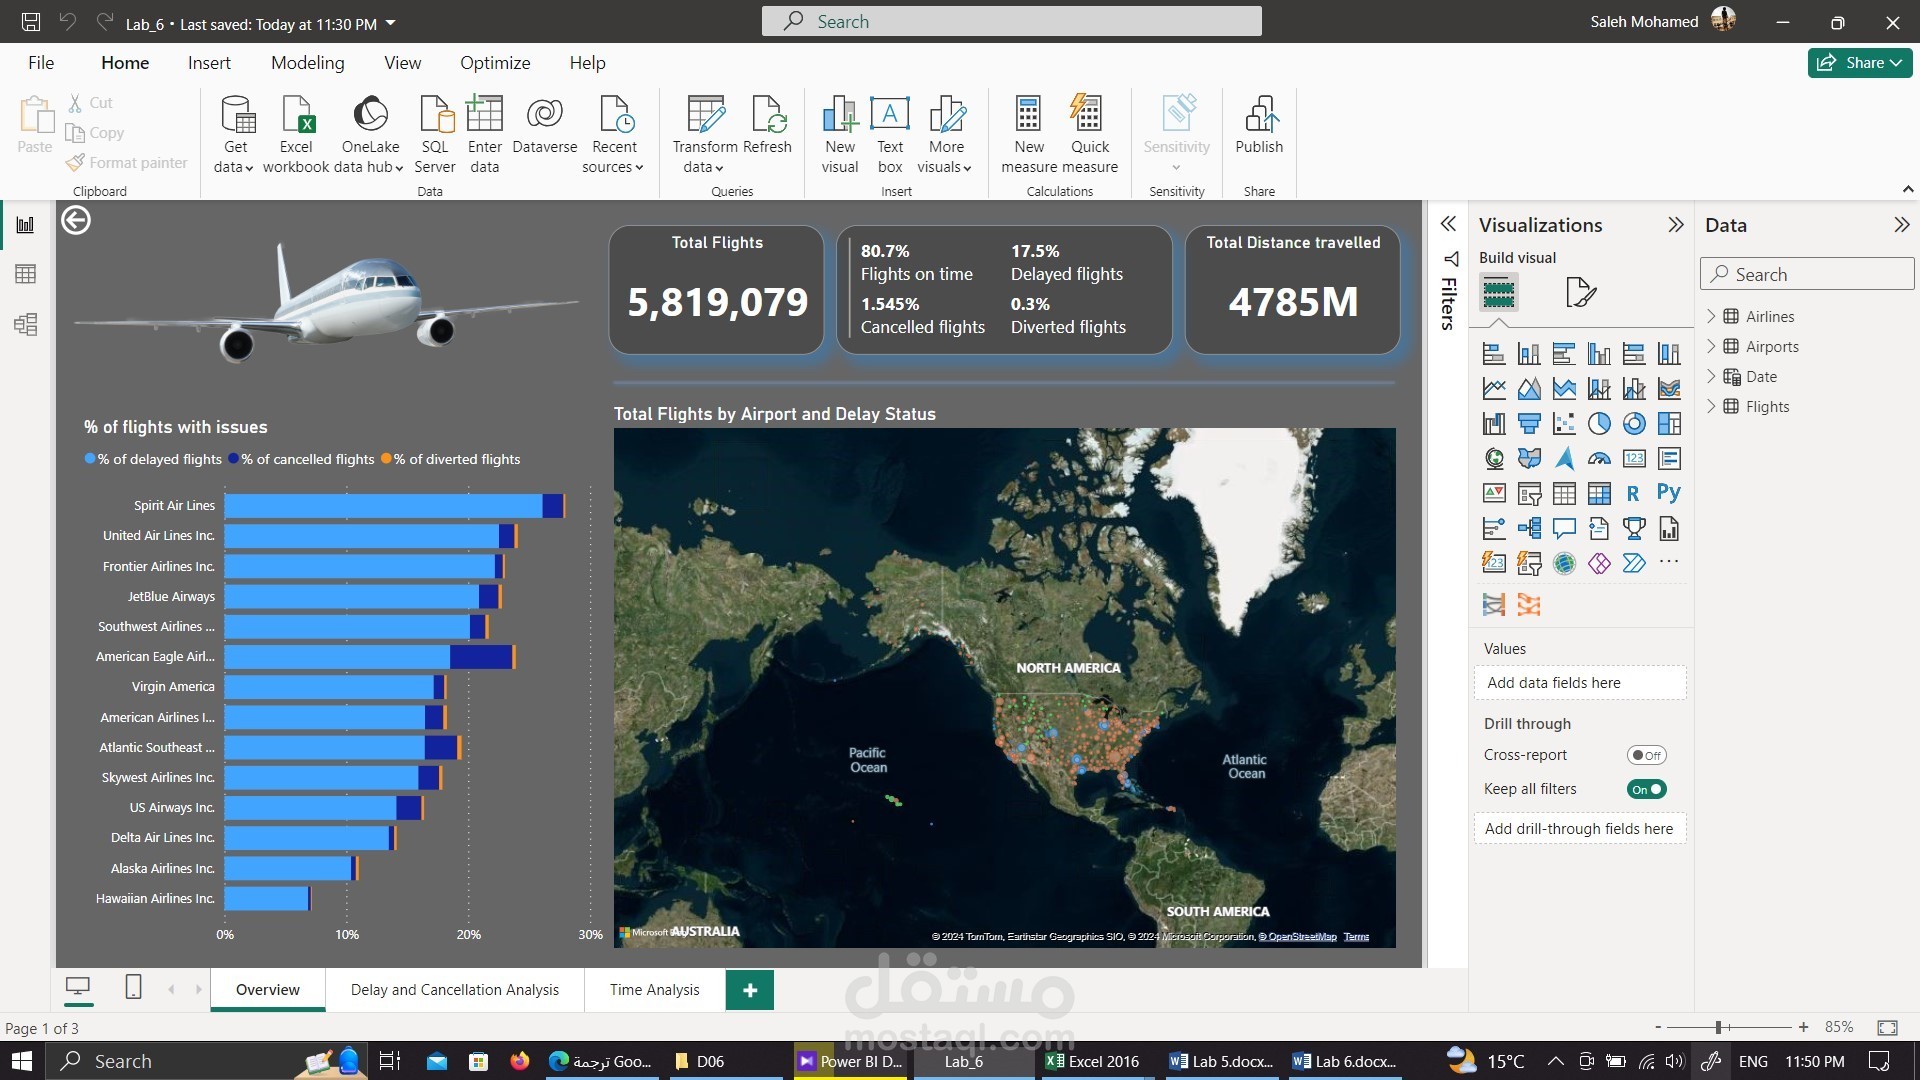
Visualization:
Use charts, graphs, and tables to visualize data in a clear and understandable manner. Common visualization types include:
Line charts for trends over time
Bar charts for comparisons
Pie charts for percentage breakdowns
Gauges for goal tracking
Heatmaps for geographical analysis
Sales Funnel:
Include a visual representation of the sales funnel to track leads through various stages of the sales process. This helps identify bottlenecks and areas for improvement.
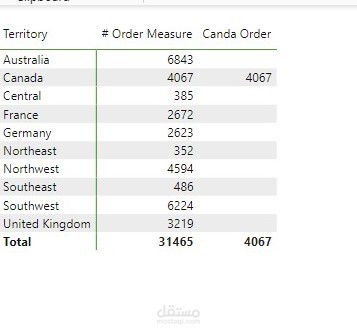
Regional and Team Performance:
If applicable, include regional or team breakdowns to assess performance across different territories or sales teams. This can help in identifying high-performing regions or teams and areas that may need additional support.
Customer Segmentation:
Segment sales data based on customer characteristics such as industry, size, or location. This can provide insights into which customer segments are most profitable and where additional efforts may be needed.
Real-time Updates:
Whenever possible, integrate real-time data updates to ensure that the dashboard reflects the most current information. This helps in making timely and informed decisions.
Mobile Compatibility:
Design the dashboard to be responsive and compatible with mobile devices. This ensures that sales teams can access important information on the go.
Data Drill-Down:
Allow users to drill down into specific details for a more in-depth analysis. This could include clicking on a specific data point to view detailed information or filtering data based on specific criteria.