Road Accidents Project
تفاصيل العمل
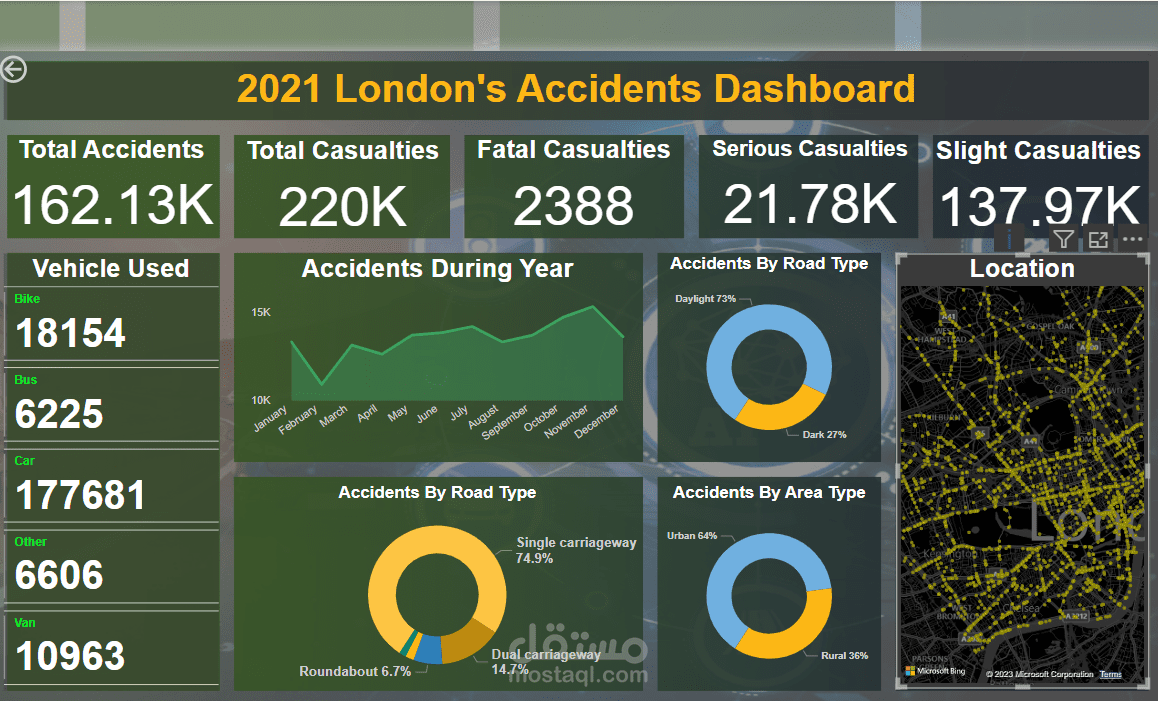
Project Overview:
The project focuses on creating a comprehensive dashboard in Power BI to analyze and visualize road accidents that occurred throughout the year 2021 in the United Kingdom. The goal is to provide insights into accident trends, locations, contributing factors, and other relevant information to facilitate informed decision-making and enhance road safety measures.
Key Features:
Accident Location Mapping:
Interactive maps displaying the geographical distribution of accidents across the United Kingdom.
Ability to drill down to specific regions, cities, or even individual accident locations.
Temporal Analysis:
Time-series analysis to identify patterns and trends in road accidents throughout the year.
Monthly, weekly, and daily breakdowns to pinpoint high-risk periods.
Severity Analysis:
Categorization of accidents based on severity (fatal, serious, slight).
Comparative analysis of different accident severity levels.
Contributing Factors:
Identification of key factors contributing to accidents (e.g., weather conditions, road type, time of day).
Visual representation of the impact of contributing factors on accident rates.
Demographic Insights:
Analysis of accidents based on demographic factors such as age, gender, and vehicle type.
Understanding the demographics of both victims and individuals involved in accidents.
Casualty Analysis:
Breakdown of casualties, including information on injuries and fatalities.
Correlation between accident severity and the number of casualties.
Comparative Analysis:
Benchmarking accident data against historical records for trend analysis.
Comparison with previous years to identify improvements or areas that need attention.
Data Sources:
The project utilizes data from reliable sources such as the UK Department for Transport or local authorities. The dataset includes detailed information about each accident, covering factors like location, date and time, contributing factors, vehicle details, and casualty information.
User Interactivity:
The Power BI dashboard is designed to be user-friendly, allowing stakeholders to interact with the data dynamically. Users can apply filters, select specific regions, and explore the data from various perspectives to derive meaningful insights.
Benefits:
Enhanced understanding of road accident patterns and contributing factors.
Facilitates evidence-based decision-making for road safety measures.
Provides a valuable tool for policymakers, law enforcement, and researchers to address and mitigate road accidents.