NETFLIX Financial Performance Analysis
تفاصيل العمل

Objective: To investigate Netflix's financial growth, profitability, expense management, subscriber base evolution, and earnings per share, leveraging EDGAR and Netflix's financial statements.
Key Analyses and Tools:
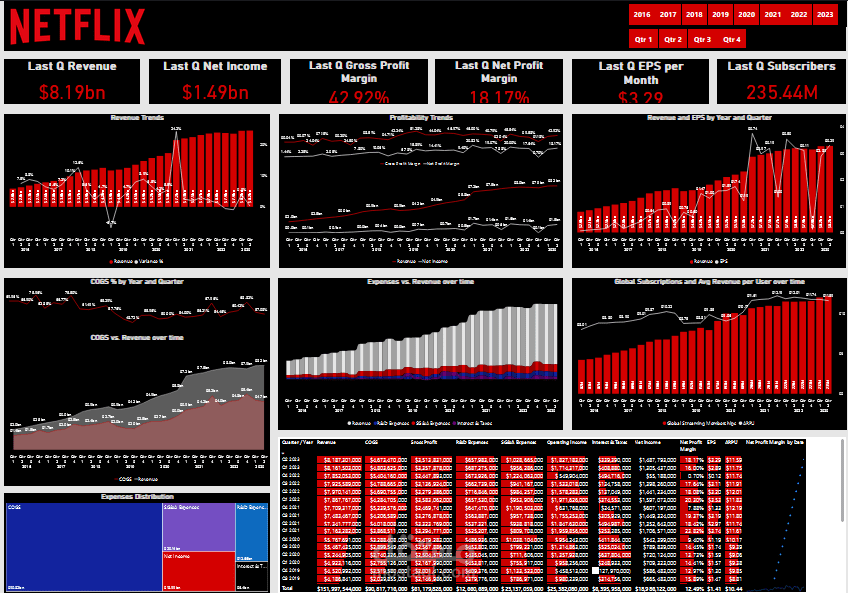
- Revenue and Profitability: Analyzed trends in Netflix’s revenue growth, gross profit margin, and net profit margin from 2016 to 2023.
- Expense Management: Explored how costs, particularly content and operational expenses, align with revenue.
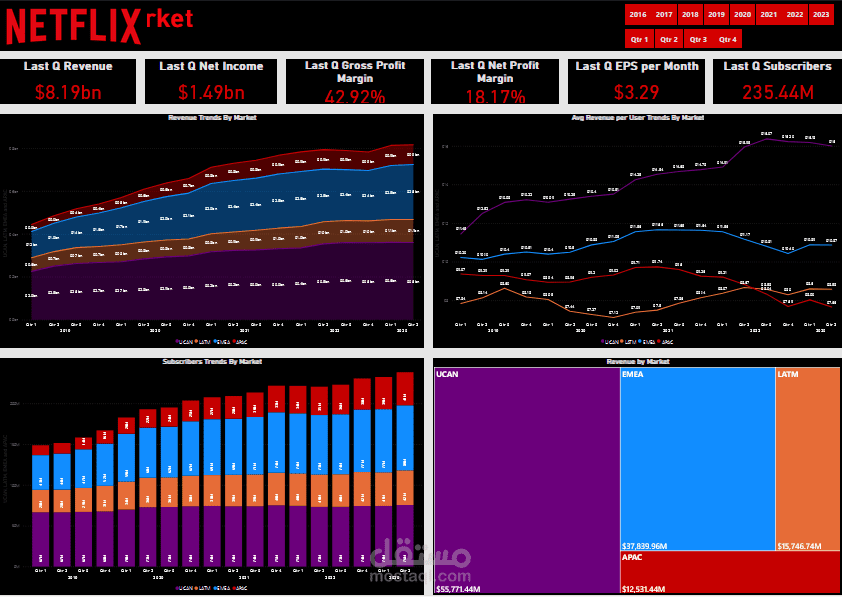
- Subscriber Growth: Examined the global and market-specific growth of Netflix’s subscriber base.
- Net Income and EPS: Tracked changes in net income and earnings per share over the period.
- Financial Measures: Utilized key financial metrics such as gross profit, operating income (EBIT), net income, and average revenue per user (ARPU).
- Data Visualization: Created a comprehensive dashboard in PowerBI showcasing financial overviews, trends in revenue, profitability, expenses, subscriber growth, EPS, and market-specific insights.
Insights and Takeaways:
- Impressive Growth: Netflix’s revenue soared by 320%, and its subscriber numbers increased by 190% from Q1 2016 to Q2 2023.
- Significant Milestones: Q1 2021 marked a 24.2% revenue increase due to a significant rise in new subscriptions.
- Operational Challenges: In Q4 2022, Netflix faced increasing COGS and SG&A expenses.
- Market Potential: The APAC region, with 41 million subscribers, presents significant growth opportunities.
- Global Positioning: The analysis underscores Netflix’s status as a leading player in the entertainment industry, with strategic decisions crucial for future success.