monthly planning report
تفاصيل العمل
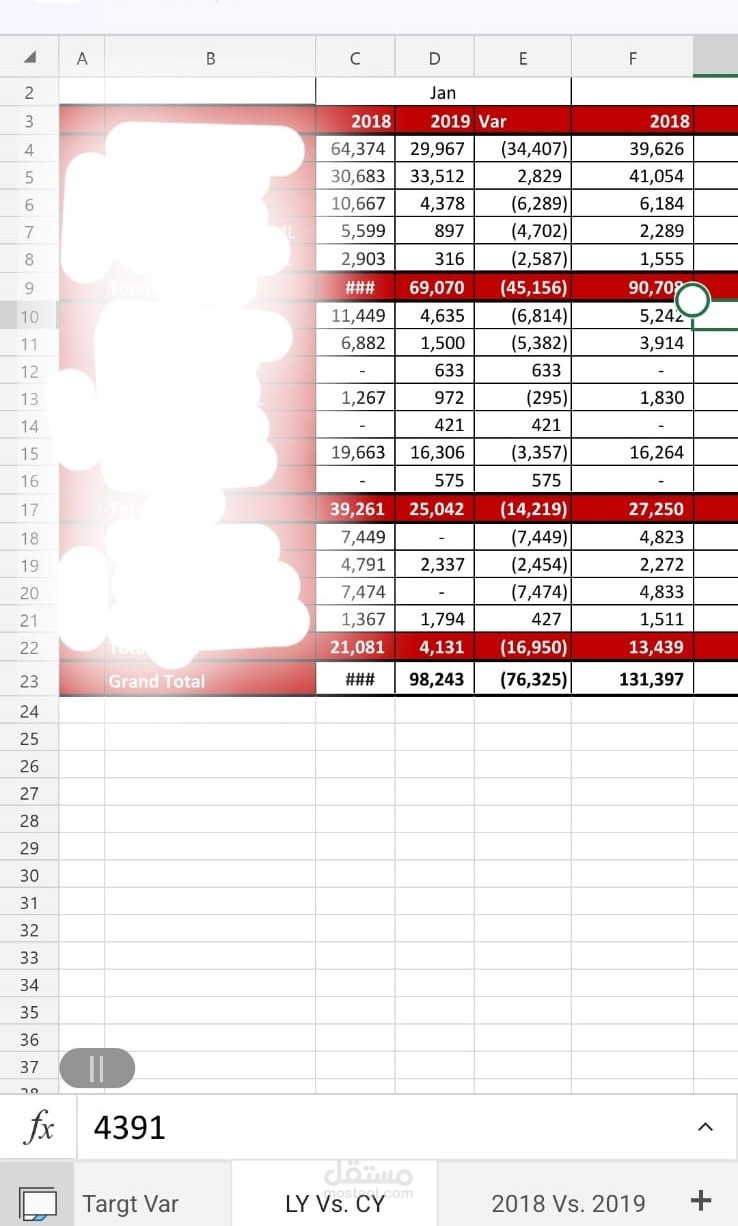
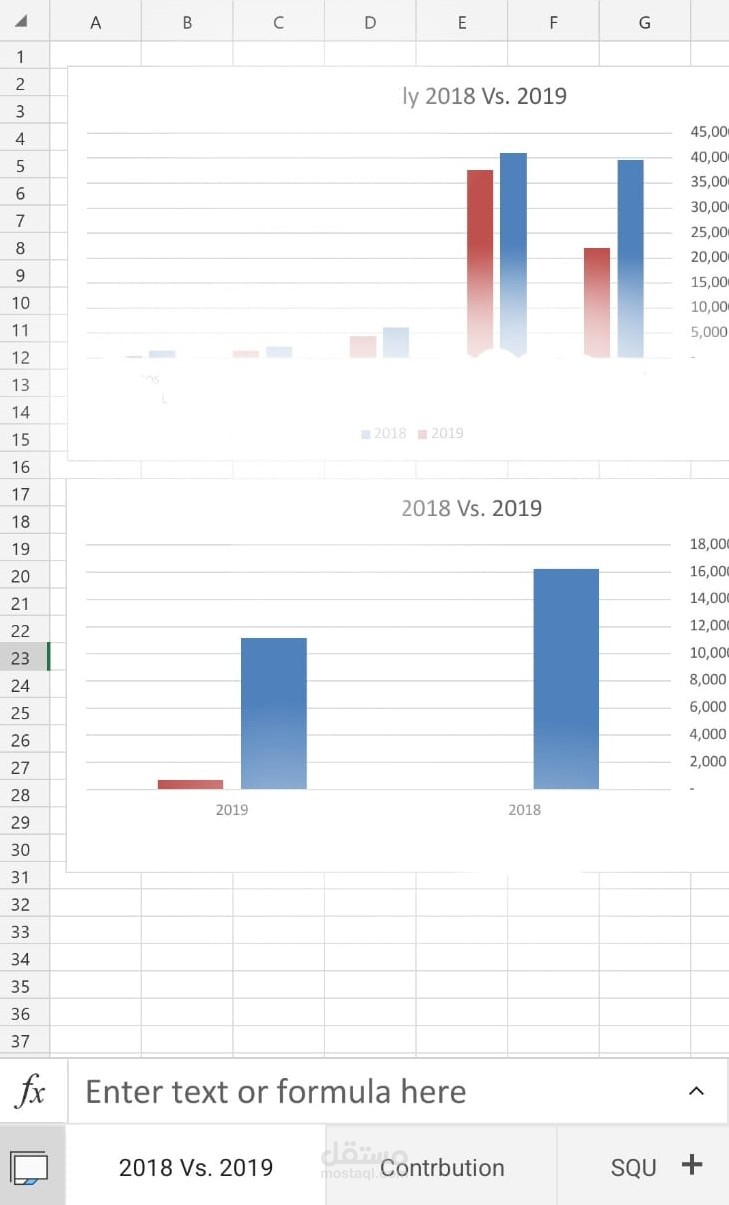
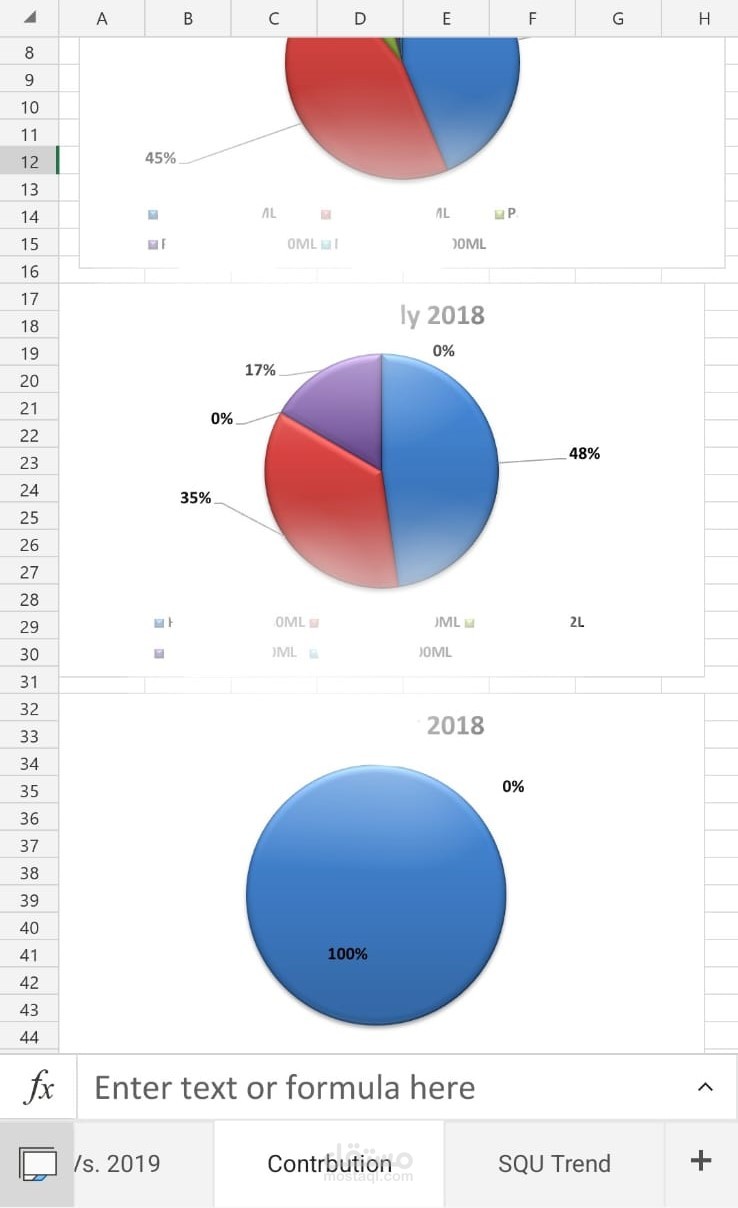
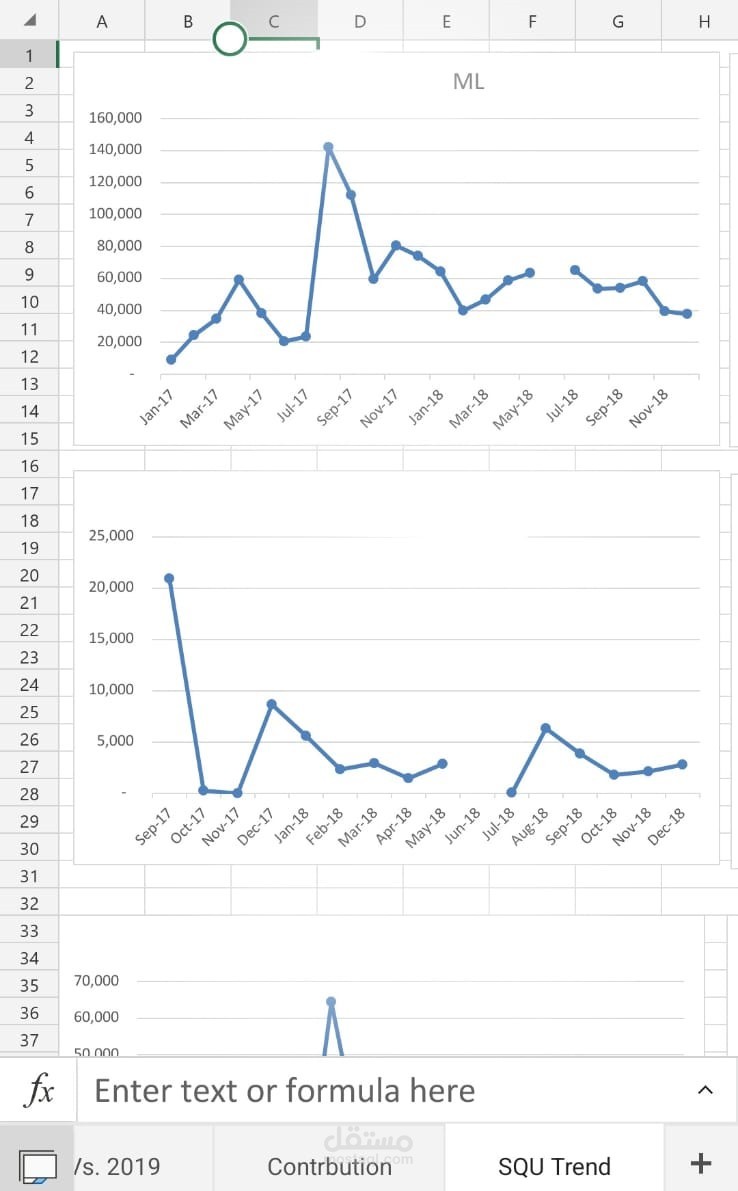
this report analyse the data of two years :
1- two years actual sales comparison
2- target vs. actual
3- pie chart for product contribution
4- line chart for seasonality
5- column chart for comparing the two years