E-Commerce Dashboard Comparing the performance between 2021-2022
تفاصيل العمل
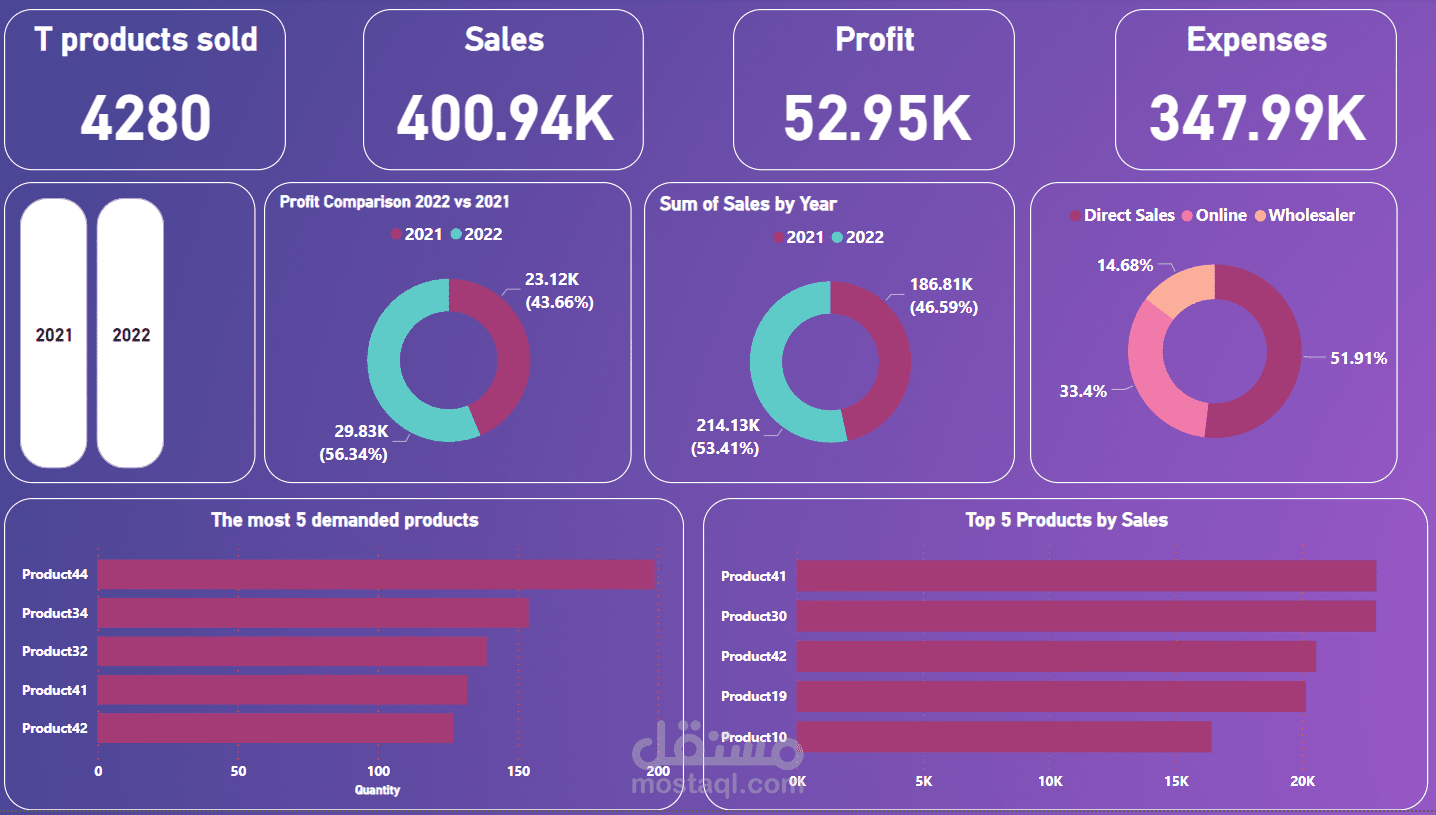
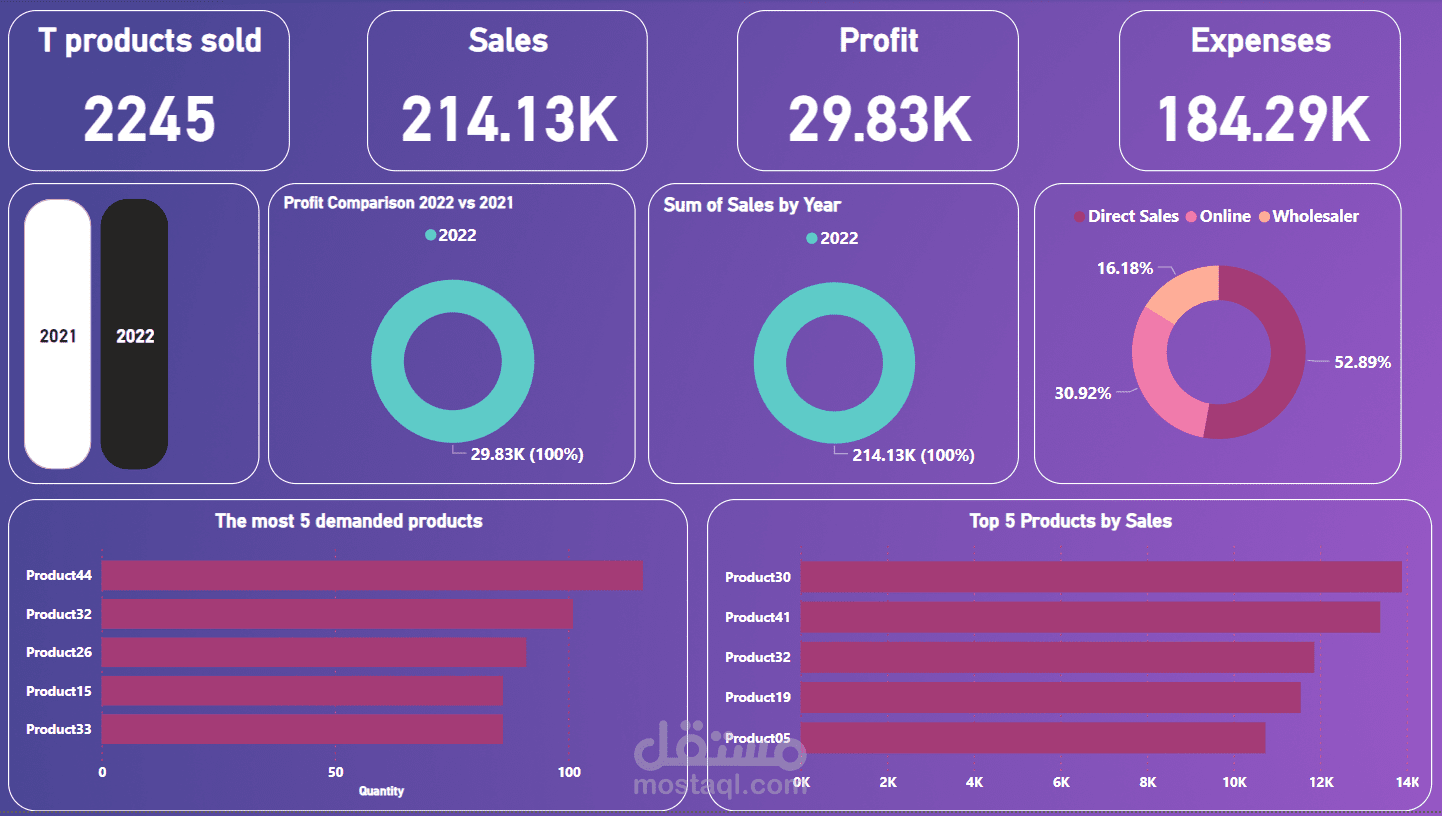

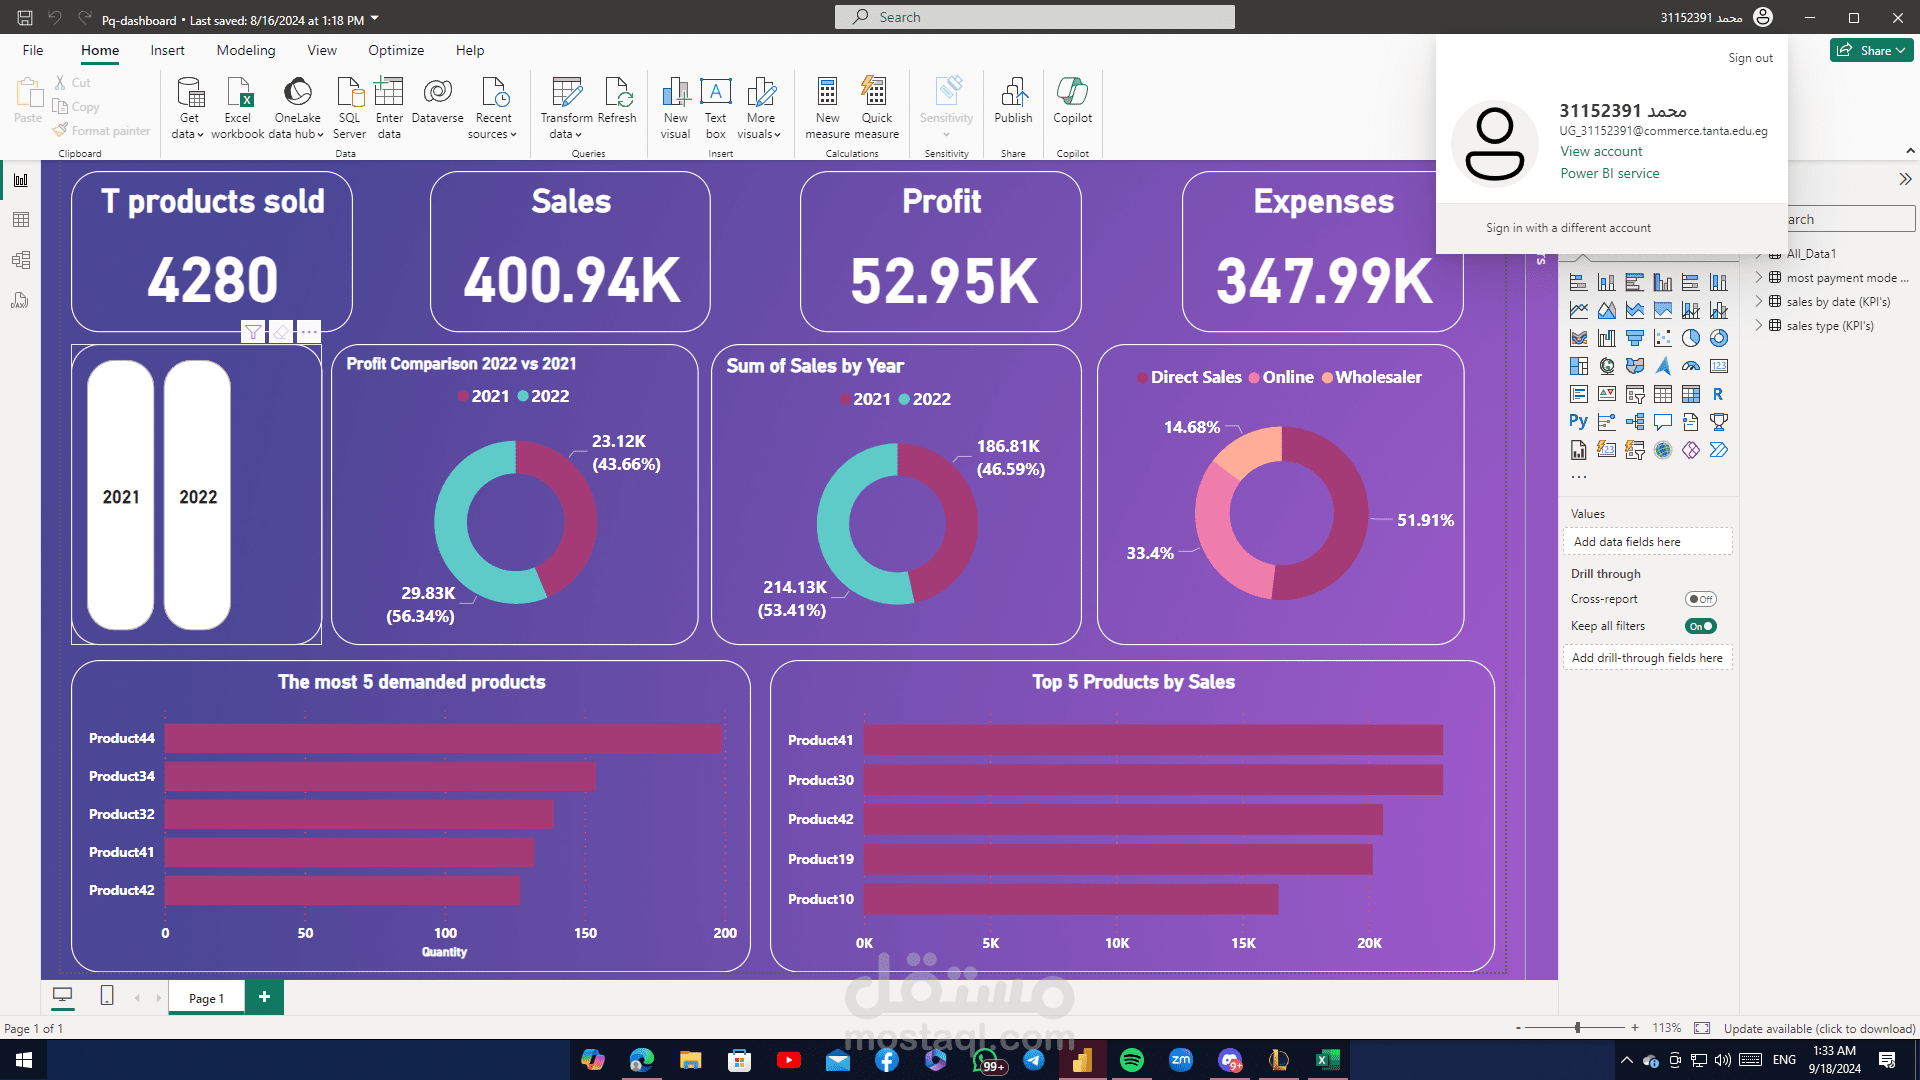
This dashboard provides a summary of product sales and company performance for 2022. It shows the total number of products sold, overall sales, profit, and expenses. It also compares the profits and sales between 2021 and 2022. The chart highlights the top 5 most demanded products and the best-selling products. Additionally, it breaks down the different sales channels such as direct sales, online sales, and wholesalers.