تحليل بيانات مبيعات الدراجة Dashboard bike sales
تفاصيل العمل
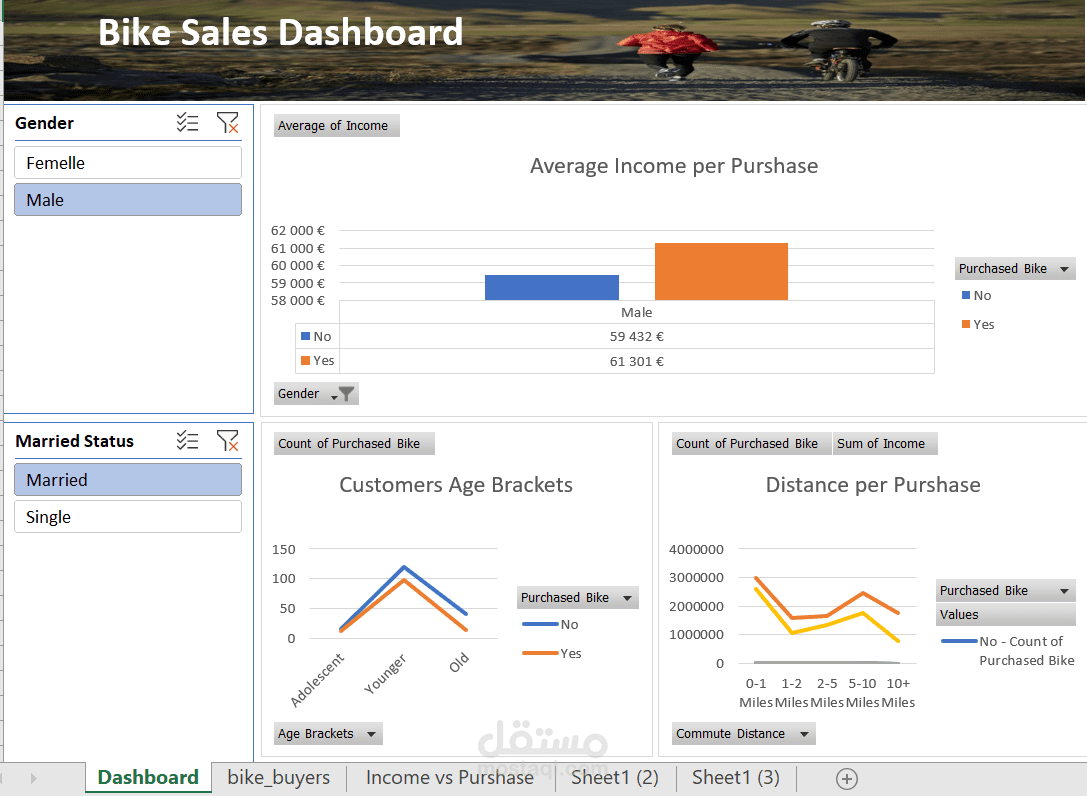
I Have currently Completed a project on Excel. The name of my project is "Bike Sales Dashboard" The main objective of this project is to create a dashboard using Excel to analyze bike sales count data across various regions, occupations, and different factors which affects the demand for bike.
To achieve the goal of this project, I have completed several tasks.
Firstly, Understanding the provided dataset.
Then I performed data cleaning to remove any duplicates, spaces, and special characters, find and replace, and formatting.
Created custom columns (Age Brackets) to extract additional information from the dataset.
Created Pivot tables, Charts, and Graphs to summarise the data and visually get quick information and make it easier to understand.
Finally, I built a dashboard in Excel with slicers, which allows users to interact with the data and view it in different ways.