sales store_with powerbi
تفاصيل العمل
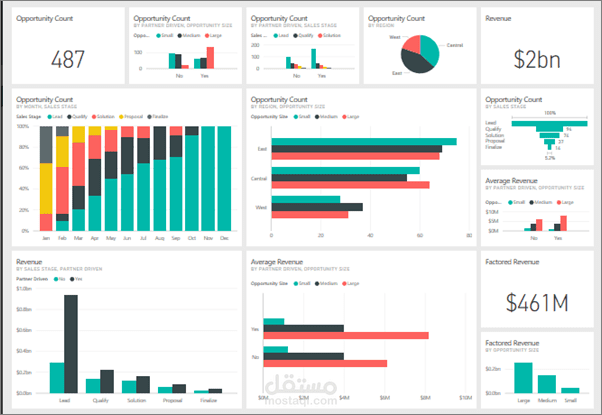
Creating a sales dashboard for a store using Power BI involves several steps, from importing data to designing visualizations. Here's a high-level overview of how to create a sales dashboard in Power BI:
Data Preparation:
Gather your sales data from various sources, such as Excel, databases, or cloud services. Ensure your data is clean and structured.
Import Data into Power BI:
Launch Power BI Desktop.
Click on "Get Data" to import your data source. Choose the appropriate source (e.g., Excel, SQL Server, Web, etc.).
Follow the prompts to connect to your data source and load the data into Power BI.
Data Modeling:
Use the Power Query Editor to transform and clean your data if necessary.
Create relationships between tables if your data includes multiple related tables (e.g., sales transactions, products, customers).
Create calculated columns or measures to derive additional insights from your data.
Data Visualization:
Build visualizations to represent your sales data. You can add visuals like bar charts, line charts, pie charts, tables, and more.
Drag and drop fields from your data model onto the appropriate visualization.
Dashboard Design:
Create a new report page for your dashboard.
Add visualizations to this page and arrange them to create a visually appealing and informative layout.
Use titles, text boxes, and images to provide context and explanations for your visuals.
Interactivity and Filtering:
Add slicers, filters, and drill-through options to allow users to interact with the dashboard.
Use cross-filtering and highlighting to make the dashboard more user-friendly.
Calculations and Metrics:
Display important metrics such as total sales, average order value, sales by product category, etc., prominently on the dashboard.
Create cards, KPI visuals, or tables to show these metrics.
Custom Visuals (Optional):
Power BI offers custom visuals created by the community or custom-developed visuals if you need specialized visualizations.
Themes and Branding:
Customize the look and feel of your dashboard using themes, color schemes, and branding options.
Testing and Validation:
Test your dashboard to ensure that all visuals work as intended and provide accurate insights.
Publishing and Sharing:
Save your Power BI report.
Publish it to the Power BI service if you want to share it with others. You can also share reports privately or embed them in web applications.
Refresh Schedules:
Set up a data refresh schedule if your data source is dynamic, and you want the dashboard to stay up-to-date.
Collaboration and Distribution:
Share the dashboard with relevant stakeholders and collaborate on insights derived from the data.
Remember to continually update and refine your Power BI dashboard as your sales data evolves or as you receive feedback from users. Power BI offers a wide range of features and customization options, so you can tailor your dashboard to meet the specific needs of your store's sales analysis and reporting.