Sales Overview
تفاصيل العمل
I'm happy to share the findings of this task from MeriSkill.
After i received the dataset file from MeriSkill, i opened it in Microsoft Excel and explored the data and the contents of each column.
I also created a new column "Day Part" to track sales during different periods of the day (Morning - Afternoon - Evening - Midnight).
Then i saved the csv file that contained the clean data, and opened it in power bi desktop to show the findings.
In power bi i created some measures, such as Revenue, Total quantities sold, as well as Total number of products.
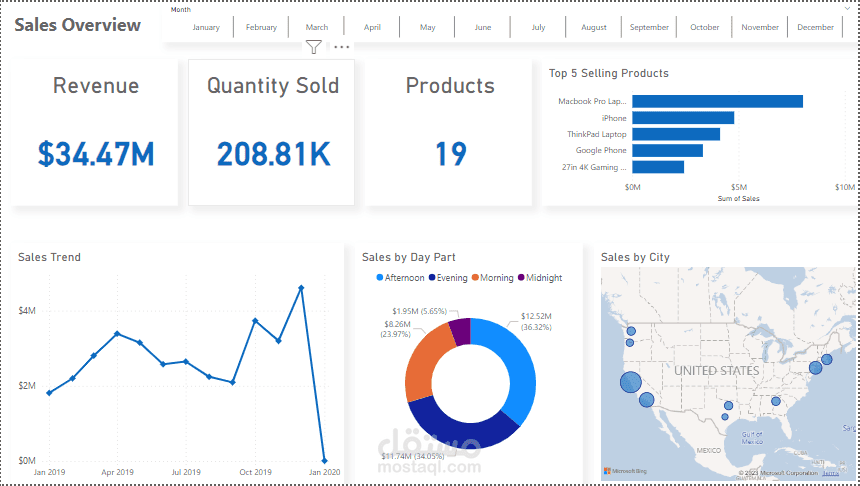
These are the results that i reached :
1 - Total sales (Revenue) : $34.47M
2 - Total quantities sold 208.812K
3 - Total products : 19 Products
4 - MacBook Pro laptop is the best-selling product with a total sales of $8,032,500 , followed by the iPhone with a total sales of $4,792,900.
5 - December 2019 is the best-selling month with a total sales of $4,608,295.70.
6 - Sales in the afternoon period were the highest with a rate of 36.32% of the total sales, followed by the evening period with a rate of 34.05%.
7 - San Fransisco achieved the largest sales with a total of $8,254,743.55.
Feel free to download the project files from this link: https://github.com/ahmeds...