Software testing metrics analysis using MS Power BI
تفاصيل العمل

Software testing metrics Analysis
8 dashboards showing different metrics
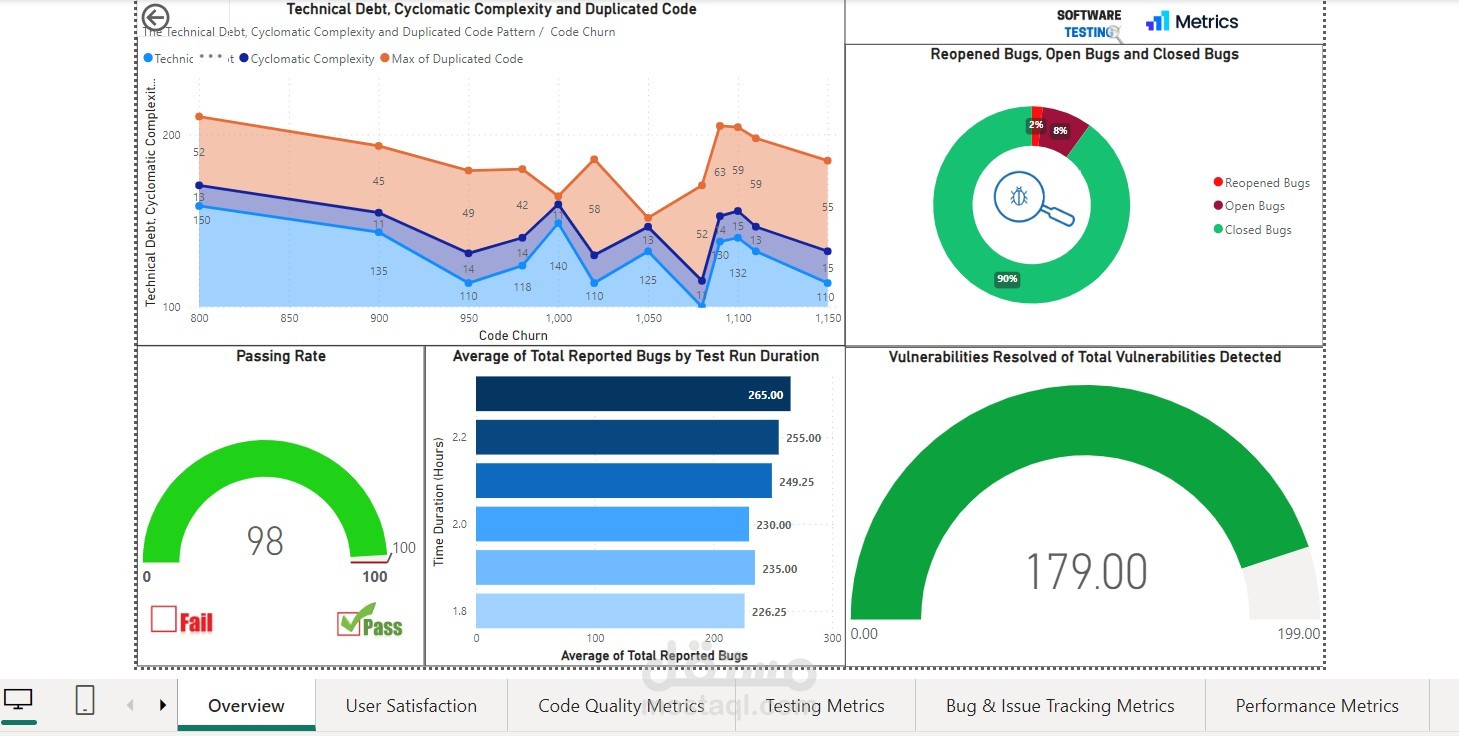
1. Code Quality Metrics:
Code Churn: Amount of code changed in a given period.
Technical Debt: Estimated effort required to fix all the code quality issues.
Code Smells: Total number of patterns in code that indicate a deeper problem.
Duplicated Code: Percentage of repeated code.
Cyclomatic Complexity: Number of independent paths through a program's source code.
Code Coverage: Percentage of code covered by unit tests.
Lines of Code (LOC): Total lines written.
2. Testing Metrics:
Total Tests: Number of tests in the test suite.
Passed Tests: Number of tests that passed successfully.
Failed Tests: Number of tests that failed.
Skipped Tests: Number of tests not executed.
Test Efficiency: Ratio of defects discovered by tests.
Test Run Duration: Time taken to run the entire test suite.
Defect Density: Number of defects per lines of code or function points.
Automated Test Coverage: Percentage of tests that are automated.
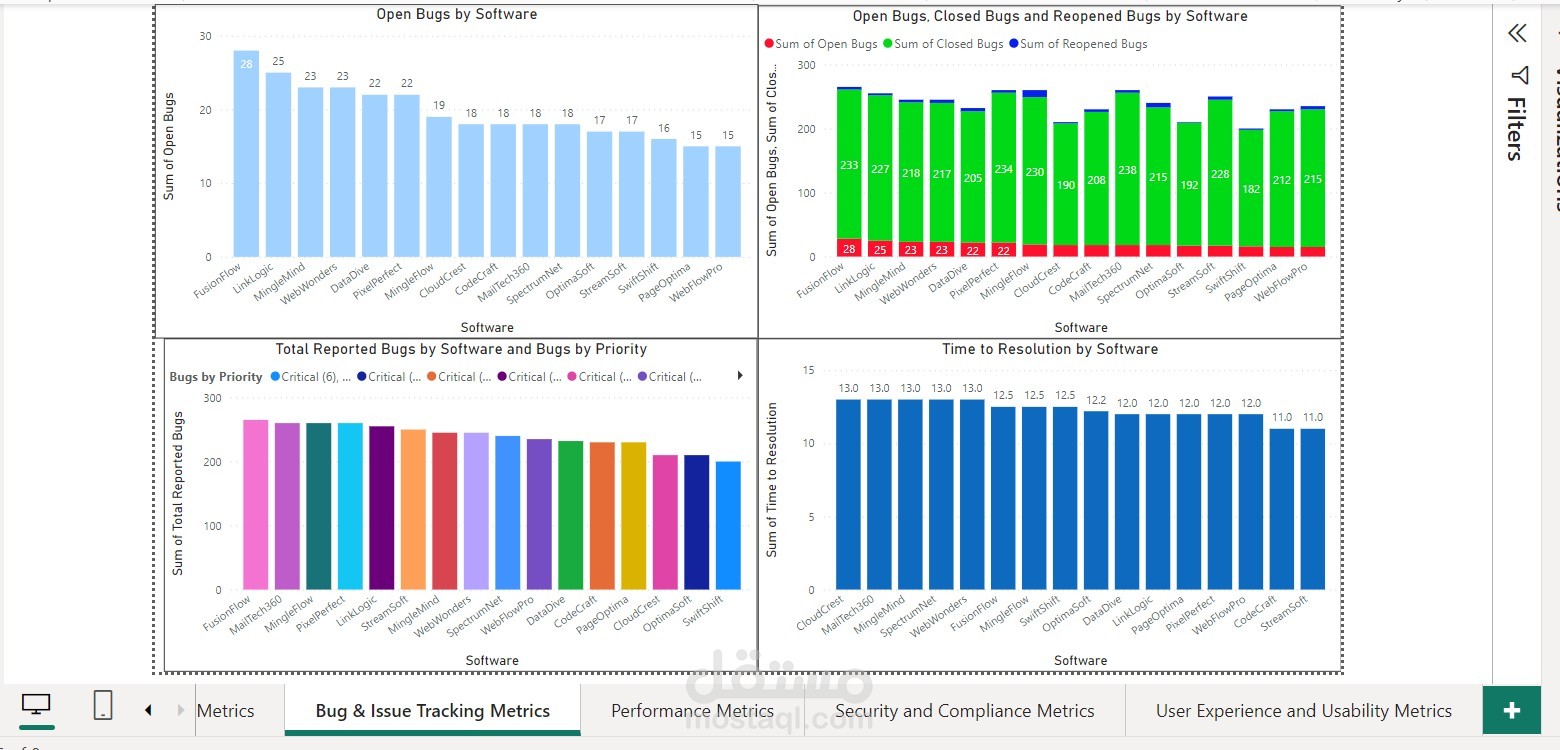
3. Bug & Issue Tracking Metrics:
Total Reported Bugs: Number of bugs reported over a period.
Open Bugs: Number of bugs currently unresolved.
Closed Bugs: Number of bugs fixed and closed.
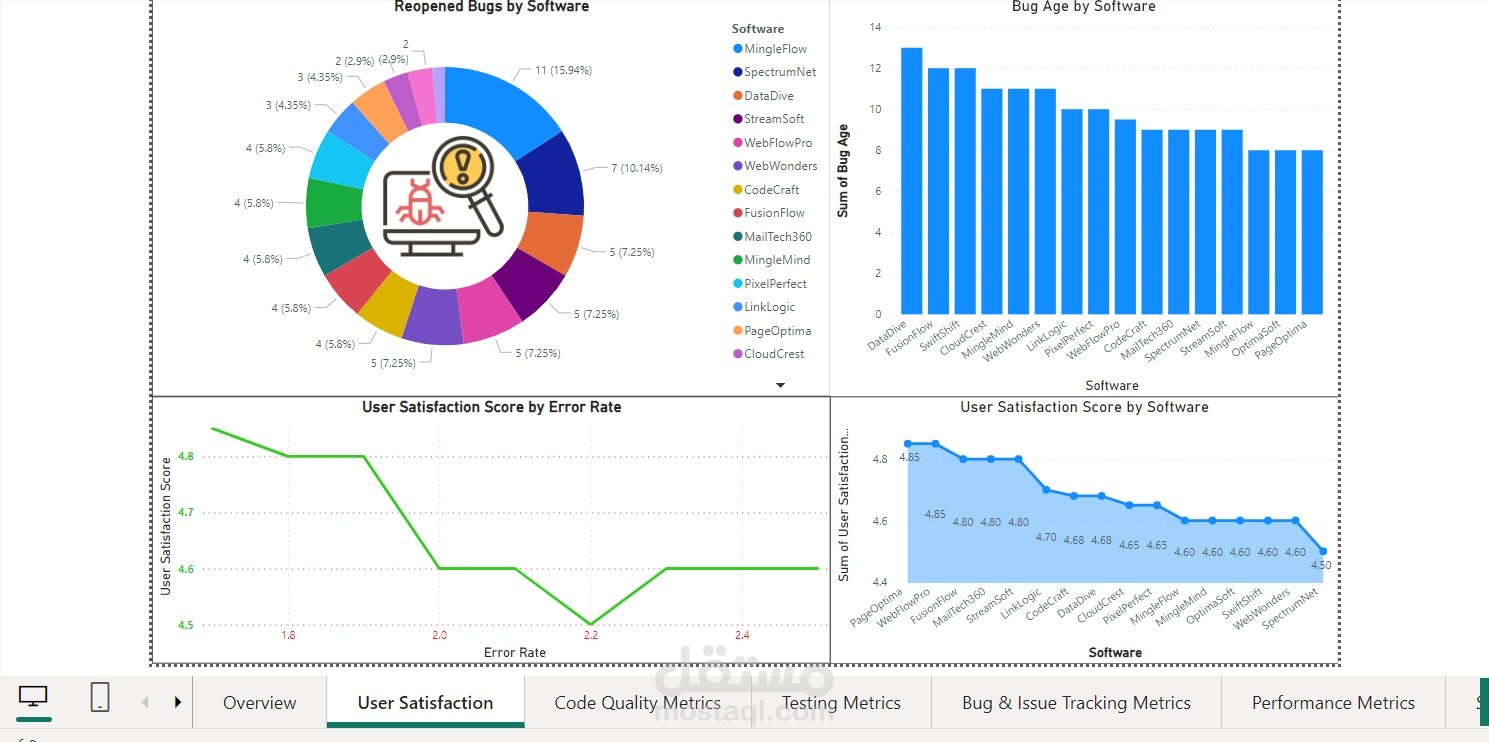
Reopened Bugs: Bugs that were closed and then reopened.
Bugs by Priority: Distribution of bugs by their priority (Critical, High, Medium, Low).
Bug Age: Duration since the bug was reported.
Time to Resolution: Average time taken to fix a bug.
Issue Resolution Rate: Rate at which issues are resolved.
4. Performance Metrics:
Response Time: Time taken for the system to respond to a user's action.
Load Time: Time taken to fully load a software application or a page.
Uptime: Percentage of time the software is operational.
Downtime: Time when the system is unavailable.
Peak Performance: Software's performance during peak load times.
Transaction Volume: Number of transactions processed in a given time frame.
5. Security and Compliance Metrics:
Vulnerabilities Detected: Total security vulnerabilities detected.
Vulnerabilities Resolved: Total security vulnerabilities fixed.
Time to Resolve Vulnerabilities: Average time taken to resolve security issues.
Compliance Score: Score based on adherence to regulatory and security standards.
6. User Experience and Usability Metrics:
User Satisfaction Score: Feedback scores from users post-release.
Task Completion Rate: Rate at which users successfully complete tasks.
Error Rate: Errors users encounter when using the software.
Average Session Duration: Average time users spend in the software.
Net Promoter Score (NPS): Measures the willingness of users to recommend your product.