Lyft dashboard
تفاصيل العمل

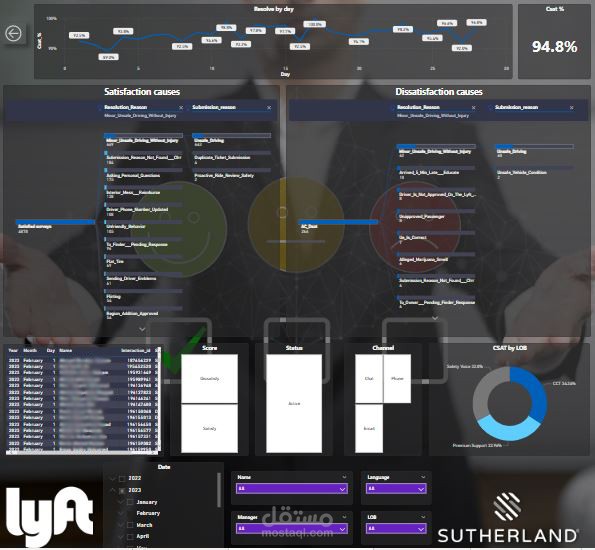
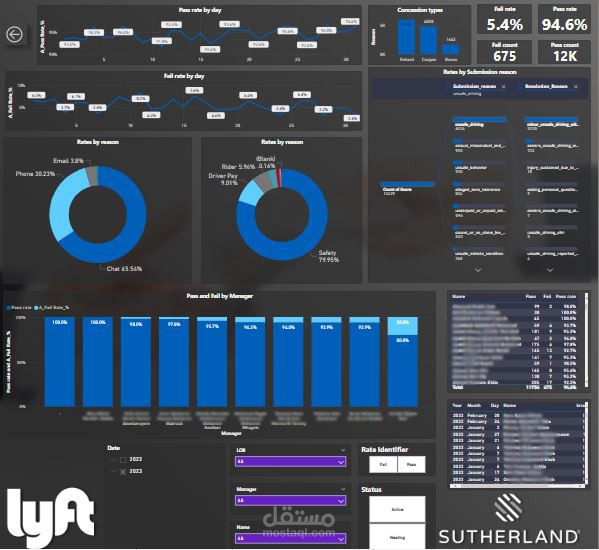
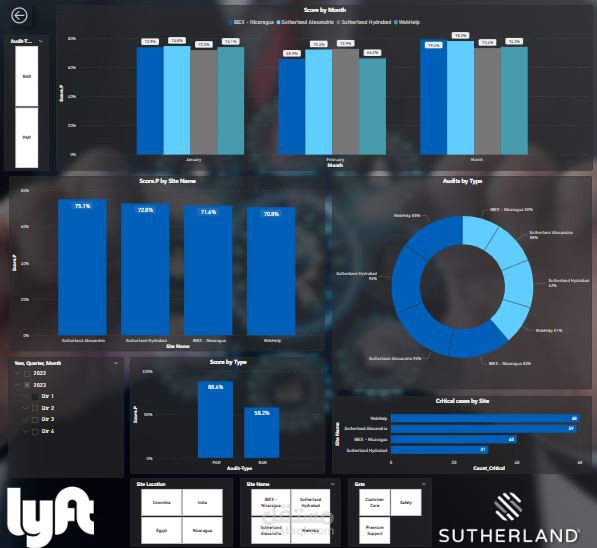
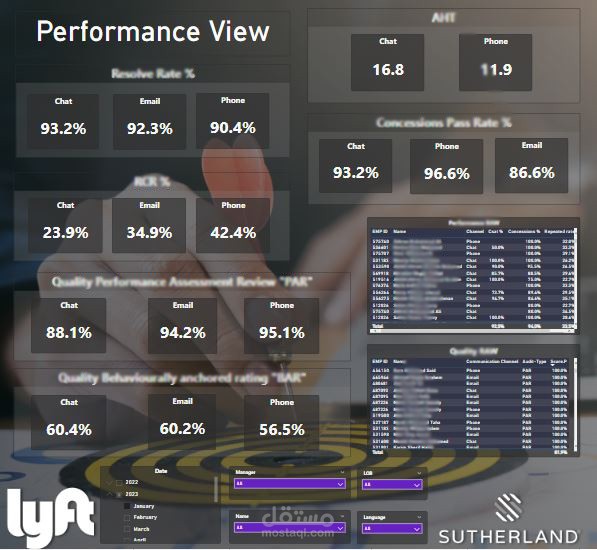
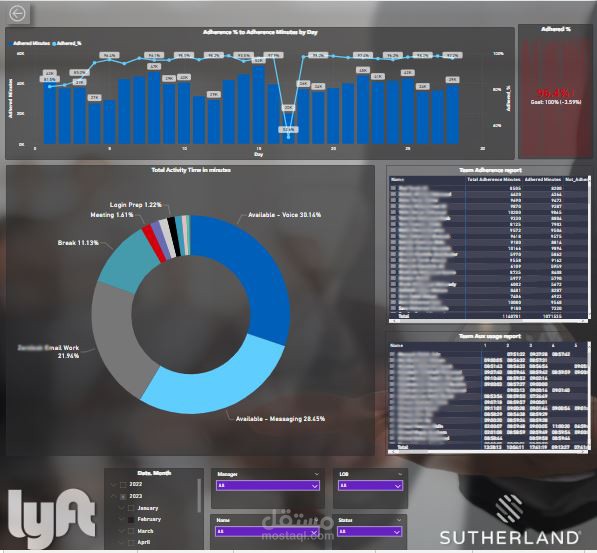
visual representation of key performance indicators (KPIs) and metrics that are used to track and measure the performance of an organization or specific business unit. A performance dashboard provides a quick and easy way to monitor progress towards specific goals, identify trends, and make data-driven decisions.
- Revenue: Total revenue generated by the organization
- Sales: Number of sales made by the organization
- Customer Satisfaction: Overall customer satisfaction score based on customer feedback
- Customer Retention: Percentage of customers who continue to use the organization's products or services
- Employee Engagement: Overall employee engagement score based on employee feedback
- Productivity: Number of tasks completed by employees per day
- Interactive Charts: The dashboard features interactive charts that allow users to drill down into specific metrics and KPIs to gain deeper insights into performance trends and identify areas for improvement.
- Real-Time Updates: The dashboard is updated in real-time, providing up-to-date information on the organization's performance.
- Customizable Views: Users can customize the dashboard to display the metrics and KPIs that are most relevant to their role or business unit.